
FIGURE 4.
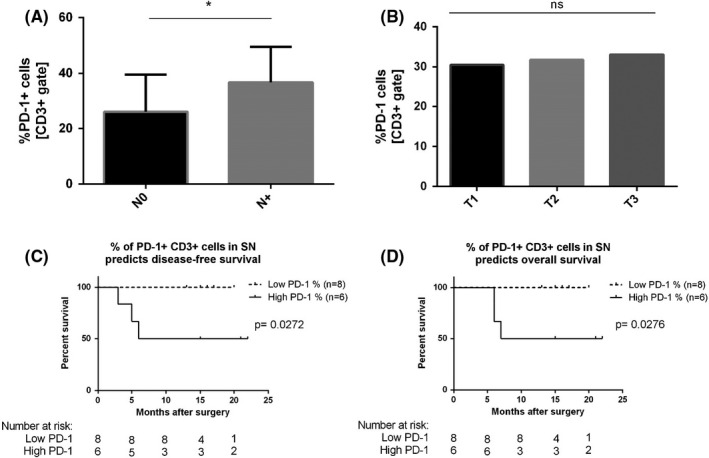
A, Expression of PD‐1 on CD3+ cells in relation to N‐status. B, Expression of PD‐1 on CD3+ cells in relation to T‐status. C, D, Kaplan–Meier analysis of DFS and OS according to percentage of PD‐1 expression CD3+ cells in sentinel nodes. The P value for the difference between the two curves was determined by the log‐rank test