FIGURE 2.

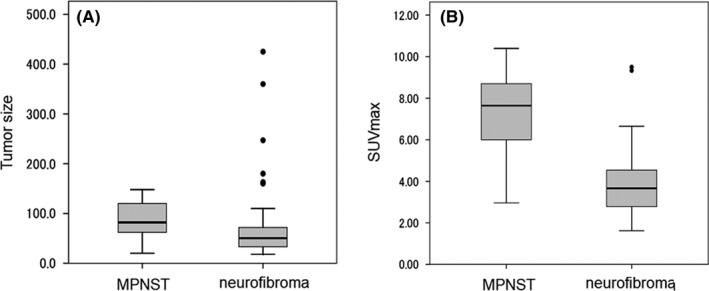
Box plots for tumor size and SUVmax value in 35 patients. Box plots show the distribution of quantitative data that facilitated comparisons between plexiform neurofibroma and MPNST. A, Tumor size, B, SUVmax

Box plots for tumor size and SUVmax value in 35 patients. Box plots show the distribution of quantitative data that facilitated comparisons between plexiform neurofibroma and MPNST. A, Tumor size, B, SUVmax