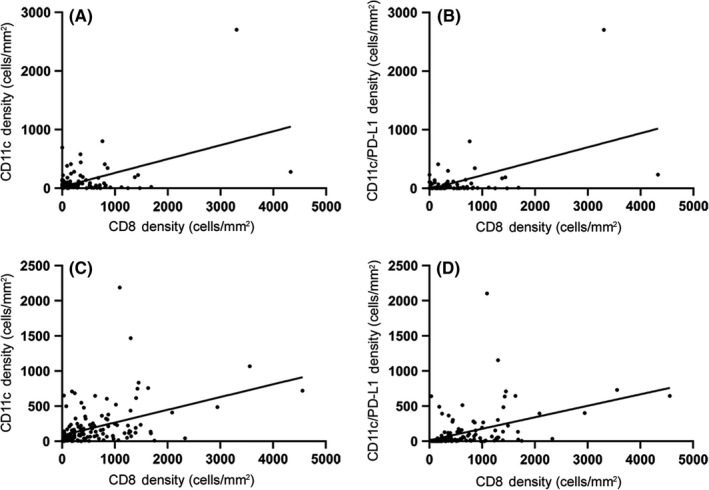
FIGURE 3.

Correlation with CD8+ cell density. Linear regression of CD11c+ cell density (A, C) and CD11c+PD‐L1+ cell density (B, D) versus CD8+ cell density in tumor epithelium (A, B) and stromal tissue (C, D). Each dot represents an individual tissue core
