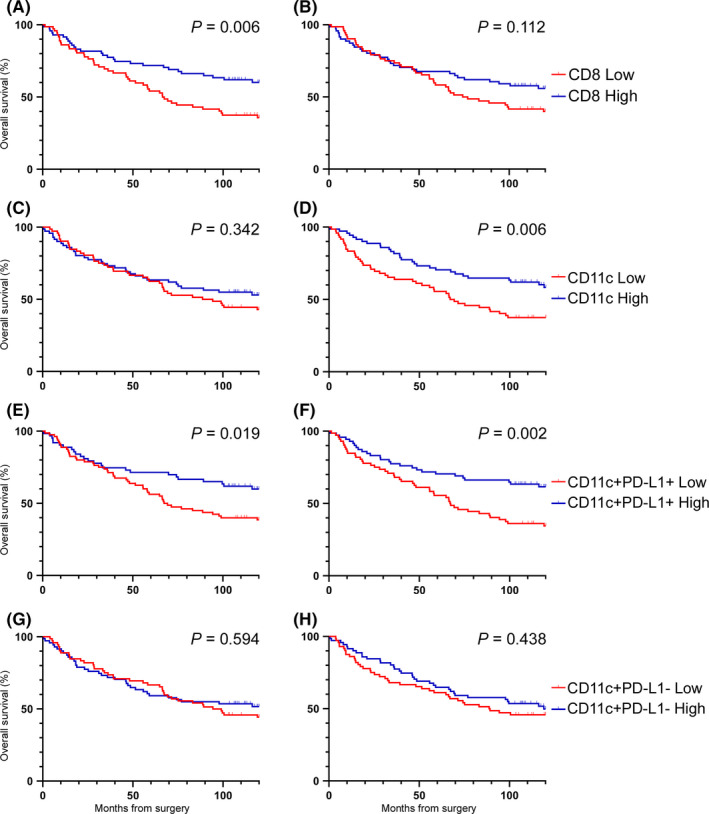
FIGURE 4.

Overall survival by cell density. Survival curves for CD8+ (A‐B), CD11c+ (C‐D), CD11c+PD‐L1+ (E‐F), and CD11c+PD‐L1− (G‐H) cell densities in tumor (A, C, E, G) and stromal (B, D, F, H) regions of leading‐edge cores. Log‐rank P‐values are presented
