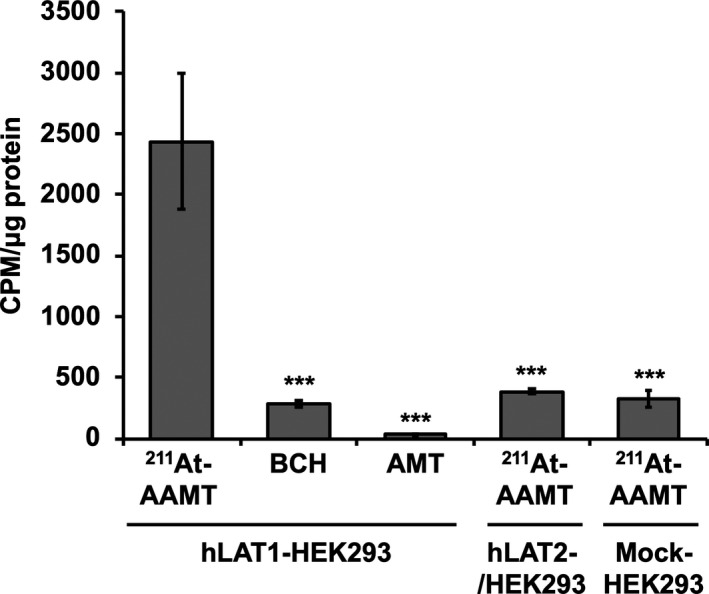
FIGURE 1.

Uptake of 211At‐AAMT in HEK293 cells. Uptake of 211At‐AAMT measured using LAT1 or LAT2 overexpressing HEK293 cell lines. LAT1 represented the uptake results of hLAT1‐HEK293 cells, LAT2 represented the uptake results of hLAT2‐HEK293, and Mock represented the uptake results of Mock‐HEK293 cells. BCH: 2‐aminobicyclo [2.2.1] heptane‐2‐carboxylic acid, AMT: α‐methyl‐l‐tyrosine. ***P < .001
