FIGURE 3.

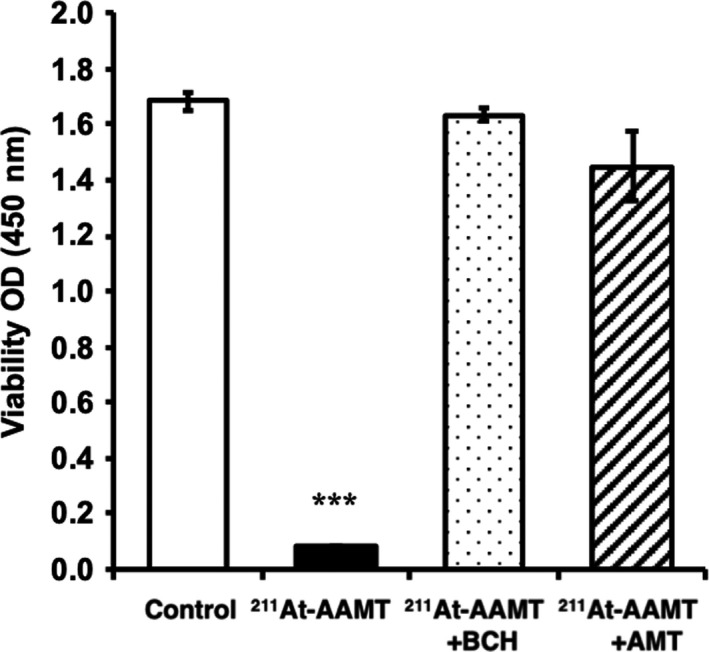
Cell toxicity of 211At‐AAMT in cancer cell lines. White bar is control, black bar is treatment by 211At‐AAMT, dot bar is treatment by 211At‐AAMT and BCH, and diagonal line bar is treatment 211At‐AAMT and AMT. ***P < .001

Cell toxicity of 211At‐AAMT in cancer cell lines. White bar is control, black bar is treatment by 211At‐AAMT, dot bar is treatment by 211At‐AAMT and BCH, and diagonal line bar is treatment 211At‐AAMT and AMT. ***P < .001