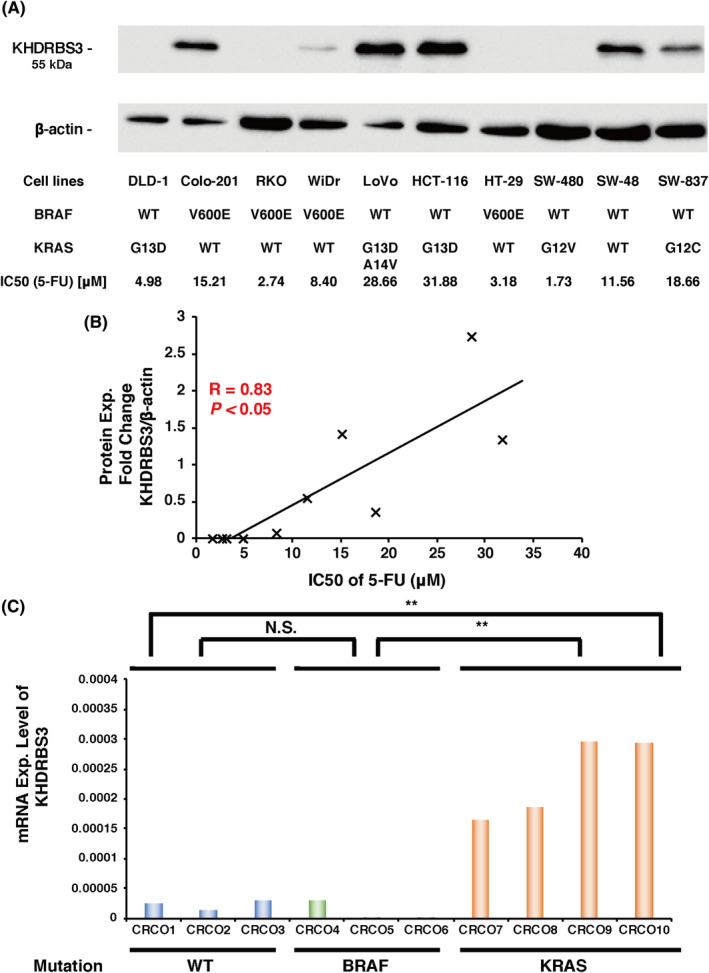
FIGURE 1.

Relationship between the expression level of KHDRBS3 and the IC50 values of 5‐FU. A, Protein expression levels of KHDRBS3 were determined in CRC cell lines. Mutation status of cancer‐critical genes and IC50 values of 5‐FU are also shown. B, Relationship between the expression level of KHDRBS3 and the IC50 values of 5‐FU in 10 CRC cell lines. C, mRNA expression levels of KHDRBS3 in 10 CRC organoids (CRCO). **P < .01 from Student t test. NS: P > .05 from Student t test
