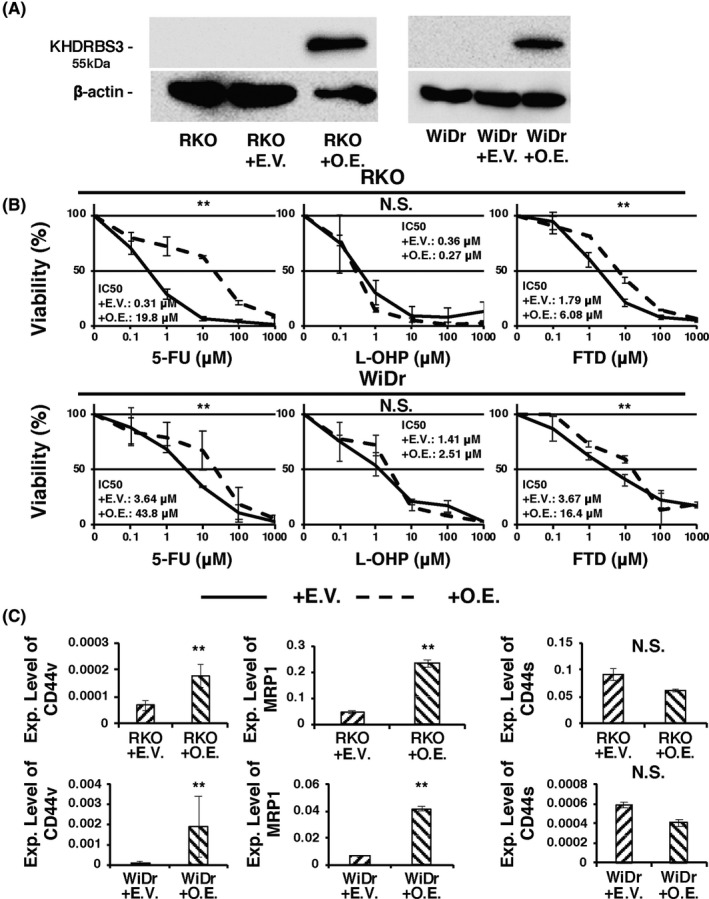
FIGURE 3.

Overexpression of KHDRBS3 in CRC cell lines. A, Western blotting analysis confirmed the overexpression of KHDRBS3. B, Dose‐response curves of RKO and WiDr transfected with empty vector (EV) or KHDRBS3‐specific overexpression vector (OE) that were treated with 5‐FU, oxaliplatin (L‐OHP) and trifluridine (FTD). Error bars represent SD. **P < .01 from Student t test. NS: P > .05 from Student t test. C, mRNA expression levels of CD44v, MRP1, and CD44s on RKO and WiDr transfected with EV or OE. Error bars represent SD. **P < .01 from Student t test. NS: P > .05 from Student t test
