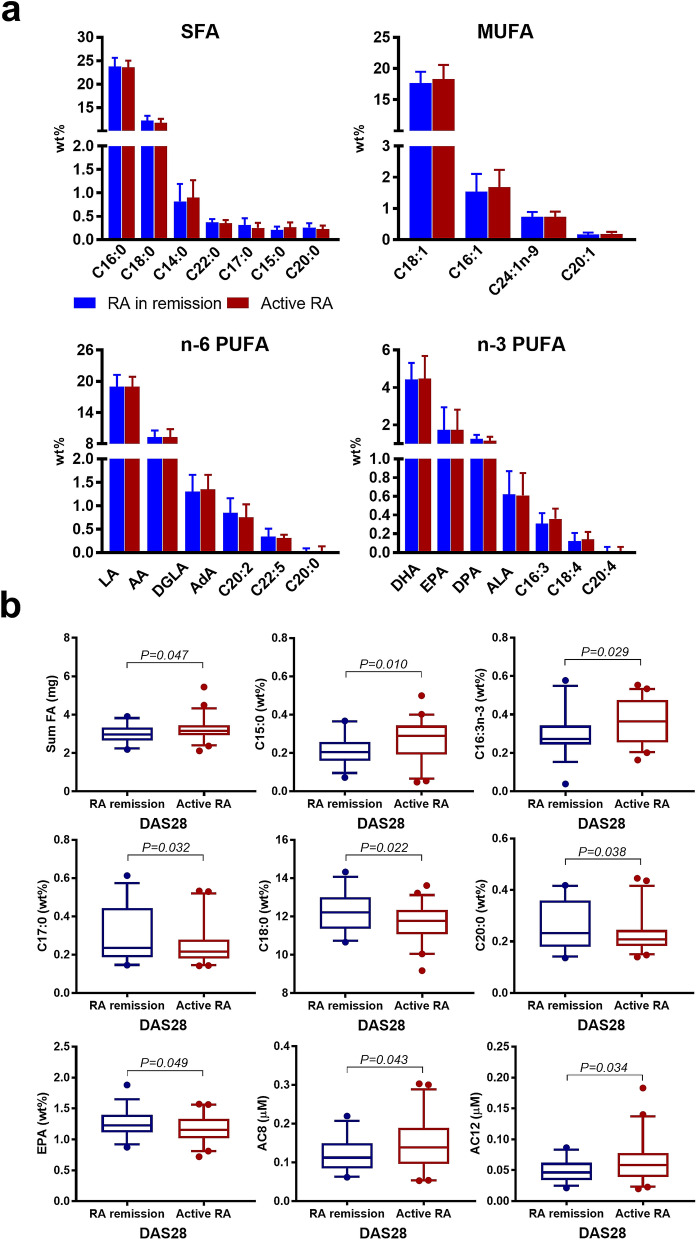
Figure 2.
Association between whole blood FA, serum lipids, serum carnitine- and choline derivatives and RA disease activity. (a) Columns show relative FA concentrations (mean ± SD) grouped by RA disease activity, DAS28 score ≤ 2.6 = RA in remission (N = 33, coloured in blue) or DAS28 ≥ 2.6 = active RA (N = 45, coloured in red) and by chemical classification (SFA, MUFA, PUFA n−6, PUFA n−3) sorted from high to low abundance. (b) Boxplots show FA, lipids, and carnitine- and choline derivatives significant associated with RA disease activity status (RA in remission (N = 33, coloured in blue, active RA (N = 45, coloured in red). The boxplots show medians, the error bars indicate 5–95% confidence interval. The connectors show statistically significant differences, P < 0.05. P values are based on Student t-test.

