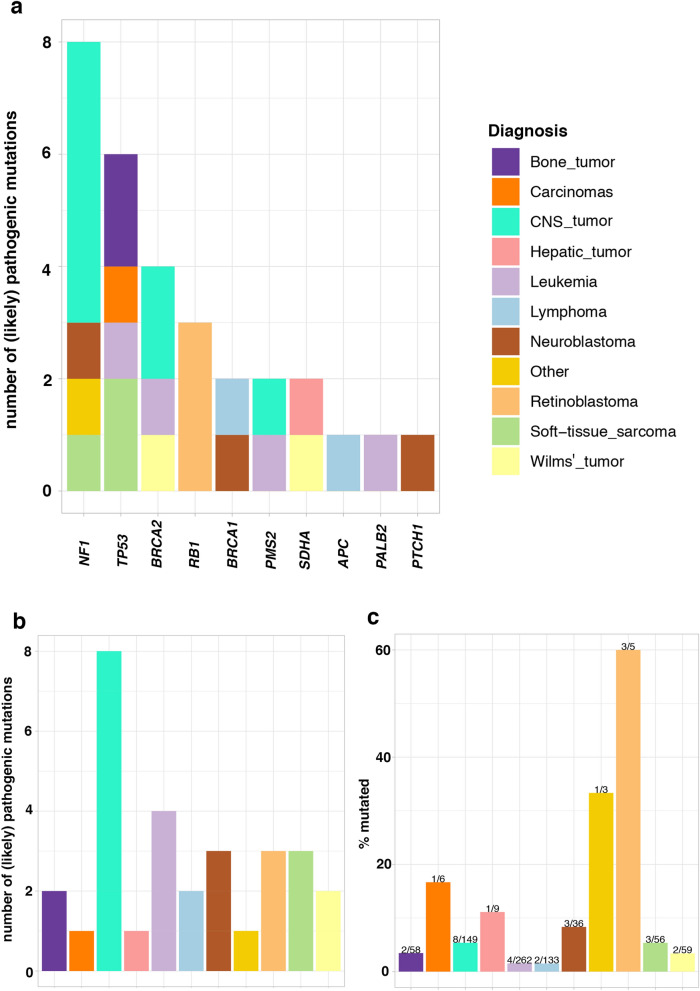
Figure 2.
Distribution of germline pathogenic and likely pathogenic variants in patients with different pediatric diagnoses in the LCCG cohort. (a) Number of patients with (likely) pathogenic variants per gene. Colors indicate the diagnosis group of each patient in which the variant was detected. (b) Total number of patients carrying (likely) pathogenic variants per cancer diagnosis group for all genes summed. (c) Percentage of patients with (likely) pathogenic variant per cancer diagnosis group for all genes summed. The number of patients carrying (likely) pathogenic variants and the total number of patients in each diagnosis group is shown above the bars.

