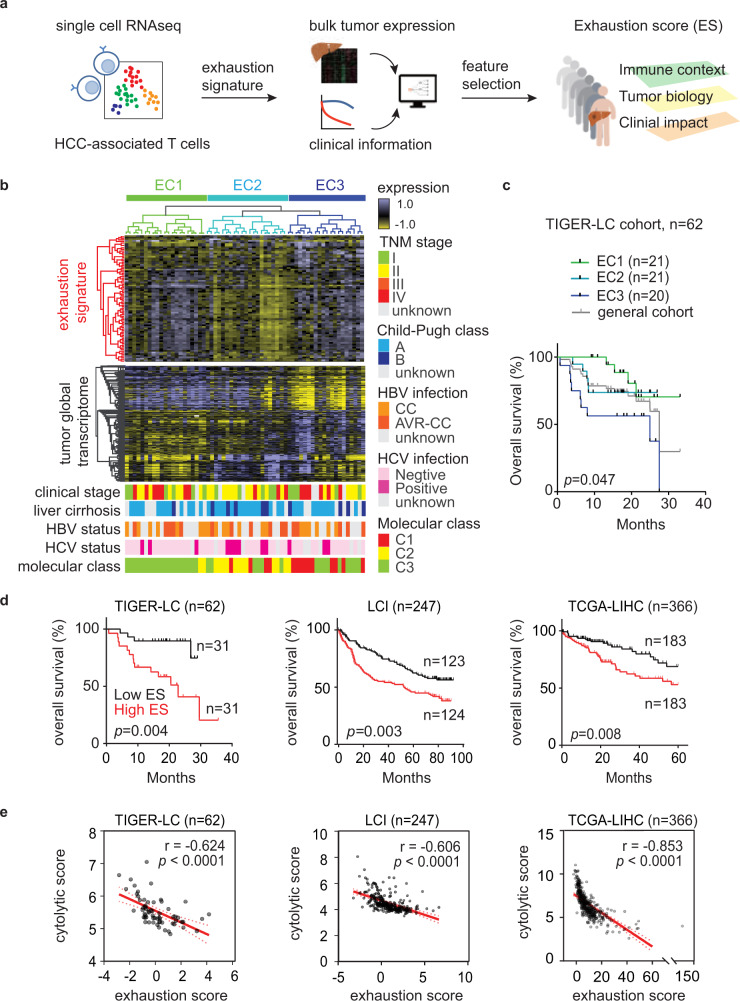
Fig. 1. Identification of exhaustion score that models CD8+ T-cell dysfunction in HCC.
a Study overview. b The expression of T-cell exhaustion signature links to tumor transcriptome and patient survival. The upper heatmap reveals the results of unsupervised hierarchical clustering of tumor samples (TIGER-LC cohort, N = 62) based on 82 genes associated with exhausted CD8 T cells (Supplementary Data 1) and the lower heatmap shows the most variable genes (n = 1533, Supplementary Data 2), and important clinical and molecular characters associated with exhaustion signature among tumor samples. According to the expressions of T-cell exhaustion genes, patients are divided into three different exhaustion clusters (ECs). c Kaplan–Meier survival analysis of the 62 HCC patients based on the ECs with two-sided log-rank p value. The survival curve of the overall cohort was shown here (gray) but was not included for the calculation of p value. d Exhaustion score predicts HCC patient survival. Patients from TIGER-LC cohort, LCI cohort, and TCGA-LIHC cohort are stratified by the median value of exhaustion score in each cohort, and the results of Kaplan–Meier survival analysis are shown here and the survival significance is determined using a two-sided log-rank test. e The correlation of exhaustion score and cytolytic score in HCC tumors. Correlation coefficient and P values are based on two-sided Spearman’s rank correlation coefficient test. Source data are provided as a Source Data file.

