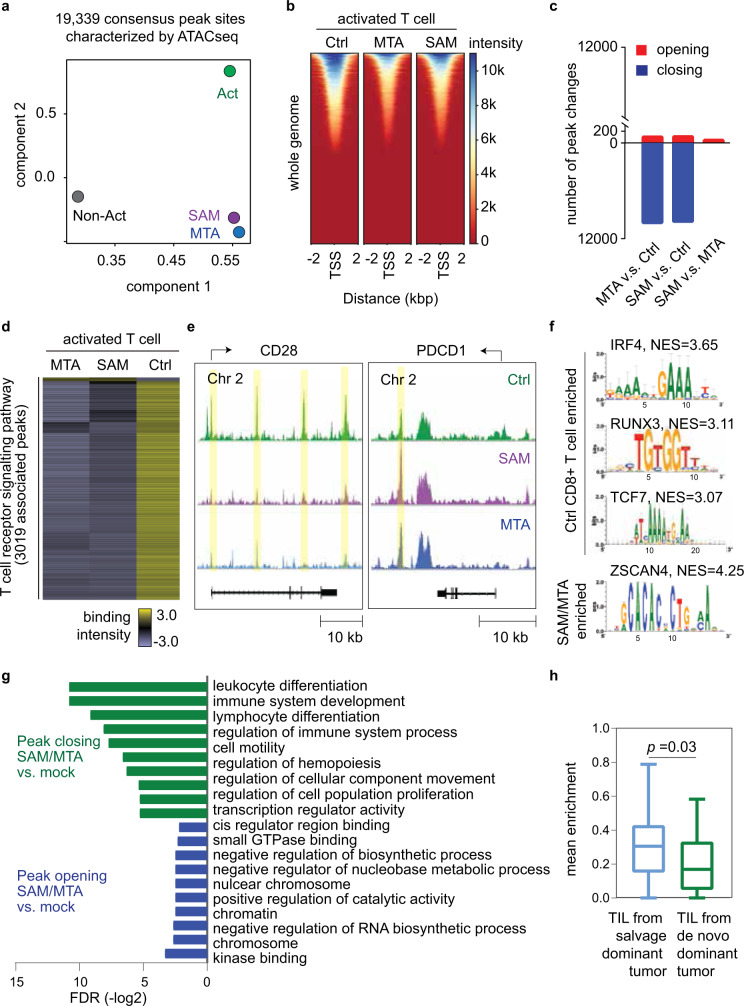
Fig. 6. SAM and MTA treatment reduced the global chromatin accessibilities of activated CD8+ T cell.
a Principal component analysis of peak accessibility in SAM-, MTA-, and mock-treated activated CD8+ T cells, as well as non-activated CD8+ T cells. Dot represented the consensus peaks of CD8+ T cells underwent indicated treatment (n = 3 in each treatment condition). b Chromatin accessibility heatmap of SAM-, MTA-, and mock-treated activated CD8+ T cells. c Number of peak changes by treatments. (FDR < 0.05). d Heatmap of accessibility intensity in 3019 loci associated with T-cell signaling pathway. e ATAC-seq coverage at CD28 and PDCD1. Peaks were highlighted in yellow. f Sequence motifs enriched in the open chromatin regions of mock-treated or SAM/MTA-treated activated CD8 T cells. g Pathway analysis of the most variable peaks associated with SAM/MTA treatment (FDR < 0.05). h SAM/MTA-induced chromatin changes correlated with T-cell transcriptome changes in clinical HCC tumors. The differentially expressed ATAC-seq peaks (FDR < 0.05, fold change >1.5) and the most differentially expressed genes in HCC tumors of TIGER-LC cohort (FDR < 0.05) were compared. After excluding tumor-specific genes, we identified 12 genes as SAM/MTA-driven T-cell genes, defined as genes showed the most variable chromatin changes in SAM/MTA-treated CD8+ T cells and, coincidentally, were significantly upregulated in salvage-dominant HCC tumors. The expressions of SAM/MTA-driven T-cell genes were examined in HCC-infiltrating T cells (GEO125449). The boxplots summarize the distribution of the mean expression of SAM/MTA-driven T-cell genes obtained from salvage-dominant tumors (n = 154 T lymphocytes from three patients) to de novo-dominant tumors (n = 21 T lymphocytes from one patient). The minimum and the maximum values are described by the extension of whiskers; the medium value is indicated by the middle line within box, and the 25th and 75th percentiles are indicated by the edges of box. Statistical significance is determined by two-sided independent t test. ATAC-sequencing data are available at the GEO repository under Study Accession GSE166213. Source data are provided as a Source Data file.

