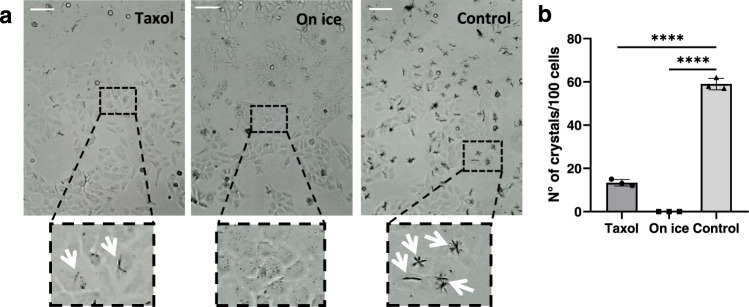
Fig. 3. Formation of QPD crystals in U2OS live cells is disrupted by induced microtubule stabilization or depolymerization.
a Representative images of crystal formation in cells treated (left) with 1 µM Taxol for 1 h and 20 µM QPD-OTf for 4 h at 37 °C; (middle) on ice for 1 h and with 20 µM QPD-OTf for 4 h on ice; and (right) with 20 µM QPD-OTf for 4 h at 37 °C. (Bottom) Zoomed-in images of cells in the black squares; white arrows indicate crystals. Scale bar 100 µM. b Quantification of the number of crystals for conditions reported in a; n = 100; data are presented as mean value ± the standard deviation (SD); data are the average of three independent experiments; Statistics were calculated using a two-tailed t-test; ****p < 0.0001. Source data are provided as Source Data file.

