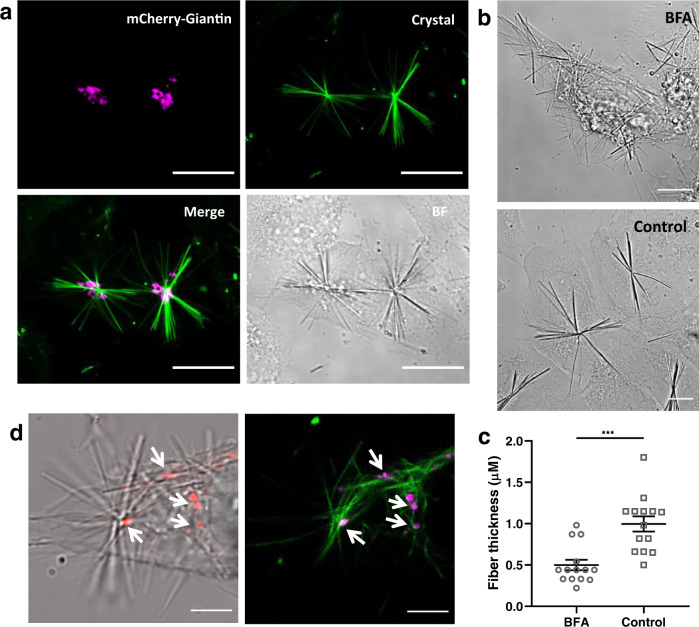
Fig. 4. The nucleation center of the QPD crystals is localized at the Golgi apparatus.
a Representative images of mCherry-Giantin transfected U2OS cells treated with QPD-OTf (20 µM 3 h). Crystals (green), mCherry-Giantin (magenta). Scale bar 20 µM. b Representative images showing the effect of brefeldin A (BFA) on crystal morphology and location. BFA treated cells (20 µM BFA 4 h + 20 µM QPD-OTf 2.5 h) (top). Control (20 µM QPD-OTf 2.5 h) (bottom); scale bar 10 µM. c Quantification of images reported in b; n = 14 fibers; data are presented as mean value ± the standard error of the mean (SEM); statistics were calculated using a two-tailed t-test; ***p = 0.0001. d Localization of crystals and Golgi vesicles after BFA treatment; Golgi (red) crystals (bright field) (left); Golgi (magenta) crystals (green) (right); arrows indicate centers of crystal; scale bar 5 µM. Source data are provided as Source Data file.

