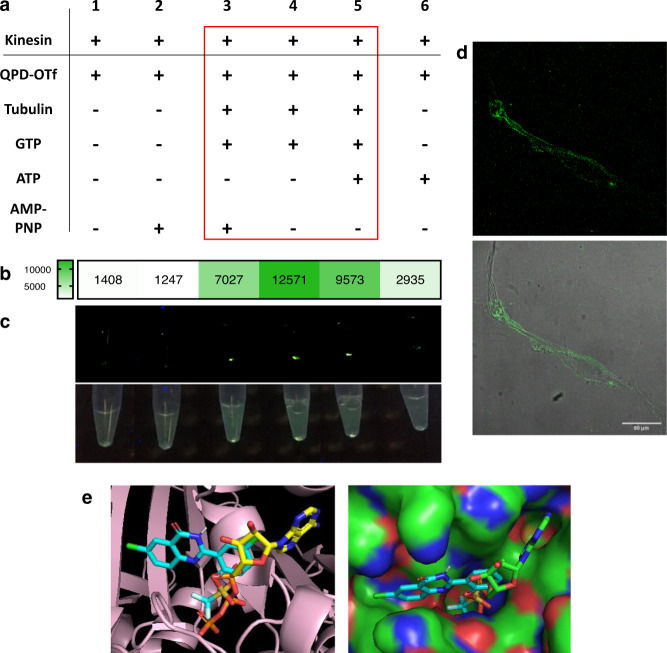
Fig. 6. In vitro and computational studies of QPD-OTf.
a In vitro precipitation of QPD; table of conditions for the samples reported in c; red square indicates the samples that gave detectable QPD-fluorescence. b Intensity map of emitted light by samples 1–6 under 366 nm excitation; intensity values are expressed as gray values from the green channel of an RGB picture acquired with a smartphone camera. c Samples under 366 nm light: green channel (top); original picture (bottom). d Confocal imaging of fluorescent filaments contained in sample 4; green: crystal. Scale bar 50 µm. e Docking of QPD-OTf into ATP binding site of kinesin-1. Left: QPD-OTf (cyan), ATP (yellow), kinesin-1 (pink); right: QPD-OTf (cyan), ATP (green), kinesin-1 (polarized surface). Source data are provided as Source Data file.

