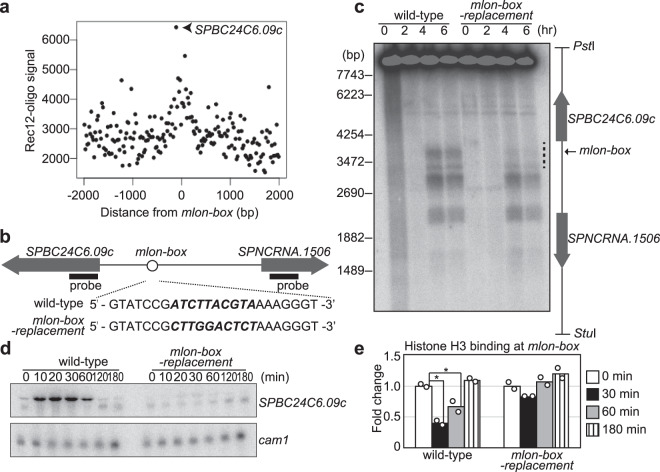
Fig. 5. DSB formation at the natural meiotic recombination hotspot in the SPBC24C6.09c upstream region is mediated by mlon-box-dependent intergenic transcription.
a Relationship between mlon-box sites and meiotic DSB distribution (Rec12-oligos). The X axis indicates the distance from the nearest mlon-box, and the Y axis indicates copy numbers of the Rec12-oligos-signal. The strongest plot (arrowhead) represents the meiotic recombination hotspot in the SPBC24C6.09c upstream region. b Schematic representation of the mlon-box (open circle) in the intergenic region between SPBC24C6.09c and SPNCRNA.1506. The entire mlon-box sequence comprising 10 nucleotides was replaced with a 10 nucleotide sequence from act1 ORF in mlon-box-replacement cells (bold italic). Location of probes for northern blot was indicated by bold bar. c Detection of meiotic DSBs in the intergenic region between SPBC24C6.09c and SPNCRNA.1506. Indicated cells were cultured and analyzed, as described in Fig. 2b. The dotted line indicates DSB sites around the mlon-box. d Northern analysis to detect the SPBC24C6.09c transcript in wild-type and mlon-box-replacement cells. The left probe indicated in Fig. 4b was used. Indicated cells were cultured to induce meiosis, as described in Fig. 2b. The cam1 transcript is shown as a loading control. e, ChIP analysis to examine histone H3 binding at the mlon-box in indicated cells. Cells were cultured to induce meiosis, as described in Fig. 2b. The relative increase in the ratio at the indicated time after the onset of meiosis is indicated. n = 2 biologically independent experiments. P-values were calculated using Student’s t-test: *P < 0.05.

