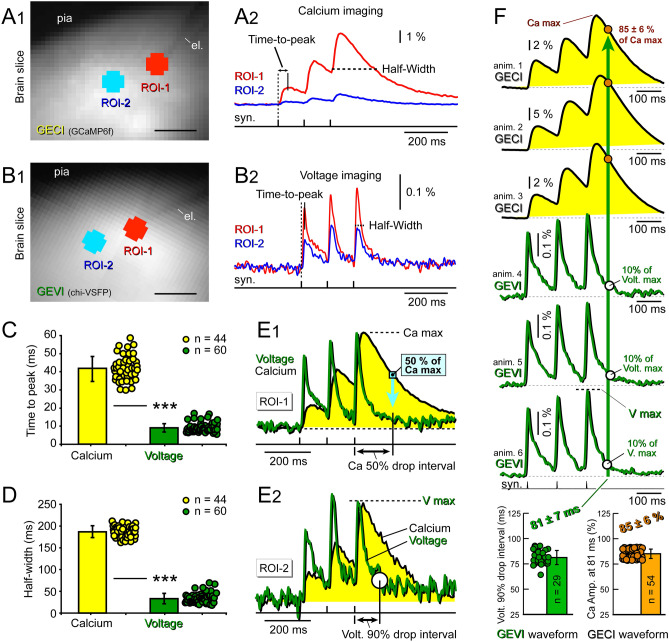
Figure 2.
Onset, duration and decay—calcium (GECI) versus voltage (GEVI) optical signals. (A1) Transgenic animal expressing GECI (GCaMP6f) in cortical pyramidal neurons. Coronal brain slice imaged by NeuroCCD 80 × 80 pixel. Scale, 200 µm. Two ROIs are selected, at the stimulation site (ROI-1), and 200 µm away from the stimulation site (ROI-2). (A2) Synaptically-evoked optical signals in GECI mouse. Time-to-peak parameter is measured between stimulus pulse and calcium signal peak. Signal duration is measured in the 3rd peak at half amplitude (Half-Width). (B1) Same as (A1), except the transgenic animal is expressing GEVI (chi-VSFP). (B2) Same as in (A2), except GEVI mouse. (C) Each dot represents one measurement (one experimental trial) of the time-to-peak parameter quantified at the stimulation site (ROI-1). Calcium: 44 trials, in 6 brain slices from 3 animals. Voltage: 60 trials, in 13 slices, of 7 animals. ***, p < 0.0001. (D) Same as in (C), except different parameter, half-width. (E1) Calcium (black) and voltage (green) optical signals are superimposed on the same time scale. Ca signal decreases 50% in time interval marked by double arrow. Vertical turquois line marks the time point “144.5 ± 10.5 ms”, when, on average, Ca signal amplitudes dropped down to 50% of their maxima. At that moment of time, “144.5 ± 10.5 ms”, Ca signal is at 50%, while the voltage trace is near the baseline (0–5%). (E2) Same as in (E1), except different ROI (away from the stimulation site, ROI-2). Voltage signal decreases by 90% in time interval marked by double arrow. (F) Three optical signals from 3 GECI animals, followed by 3 optical signals from 3 GEVI animals. Optical signals are aligned by synaptic stimulation pulses (syn.). Bottom: Green data points: time intervals (from the synaptic stimulus) at which voltage signals dropped down to 10% of their maxima (V max). The average time delay for this 90% descent was 81 ± 7 ms (n = 29). Vertical green arrow marks the time point “81 ± 7 ms” transecting voltage and calcium waveforms. Bottom, orange points: Ca signal amplitudes measured 81 ms after the syn. pulse; normalized to the “Ca max” of the same trace; 85 ± 6% (n = 54). The voltage had dropped down to 10%, while the calcium is still lingering at ~ 85%.

