Figure 3.
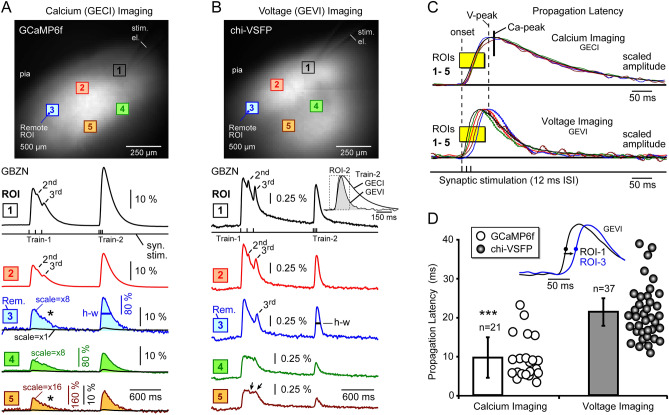
Optical signal propagation—calcium vs. voltage imaging. (A) Top, image: Surface of a cortical brain slice prepared from GCaMP6f animal, with ROIs and glass electrode for synaptic stimulation. Bottom, traces: Synaptically-evoked calcium (GECI) transients in the presence of GABA-A receptor antagonist, gabazine, GBZN [10 µM]. Synaptic stimulation comprised two triplets, 8.3 Hz (Train-1) and 83 Hz (Train-2), respectively. Optical traces were recorded simultaneously from 5 ROIs. The remote traces (ROI-3-4-5) are shown at two amplifications: × 1 (black) and × 8, × 16 (color). Asterisk marks uneventful waveform. (B) Same as in (A), except the brain slice was prepared from a chi-VSFP animal. Black arrows mark fast changes in GEVI waveforms, which are unmatched in the GECI records (asterisk). Inset: Differences in the peak timing and signal duration between a GECI and GEVI trace at ROI-2. (C) Traces from (A) and (B) (Train-2) are amplitude-scaled, time-aligned, and superimposed on a faster time scale. Yellow box on the rising slopes of traces indicates the amplitude level (half-amplitude) at which latencies were quantified. Note that voltage transients (bottom) show a greater variety of signal latencies compared to the calcium transients (top). Vertical dashed line “onset” marks the onset of synaptic stimulation. Vertical dashed line “V-peak” marks the peak of the most delayed voltage transient (ROI-3). Thick vertical line “Ca-peak” marks the peak of the GCaMP6f transients. (D) Inset: Propagation latency between two ROIs was measured at half-amplitude. White bar is an average latency measured at 500 µm away from the stimulation site, obtained in 21 recordings from 6 brain slices treated with gabazine, in 3 GCaMP animals (mean ± stdev). Gray bar is an average 500 µm latency obtained in 37 recordings from 15 GBZN-treated brain slices, in 6 chi-VSFP animals, p < 0.00001.

