Figure 4.
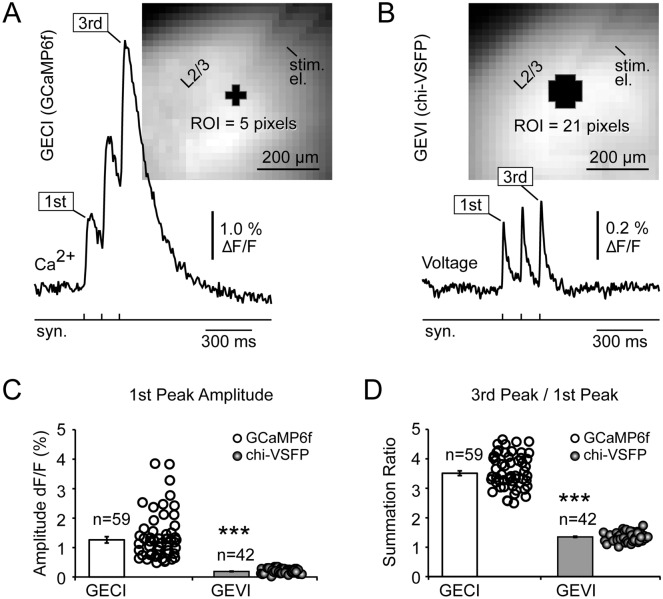
Optical SNR, amplitude (ΔF/F), and temporal summation—calcium vs. voltage imaging. (A) Image: Cortical brain slice harvested from GCaMP6f animal, with ROI and glass electrode (el.) for synaptic stimulation. Trace: Synaptically-evoked calcium transients obtained from the ROI (5 pixel spatial averaging). Synaptic stimulation comprised three pulses at 120 ms interval (8.3 Hz). Temporal average of 4 trials, bleach correction, 40 Hz low-pass. (B) Same as in (A), except brain slice harvested from a chi-VSFP animal, and much greater size of the ROI (21 pixels). (C) Amplitude (ΔF/F) of the 1st transient is represented by a raster dot plot and the color-matched bar (mean ± sem). *** indicate p < 0.00001. White (GCaMP6f): 27 recordings from 6 brain slices, in 3 GCaMP6f animals. Gray (chi-VSFP): 42 recordings from 19 brain slices, in 8 chi-VSFP animals, p < 0.00001. (D) Same as in C except, “summation ratio” was measured as an amplitude ratio between the 3rd and the 1st peak in the same optical trace.

