Figure 5.
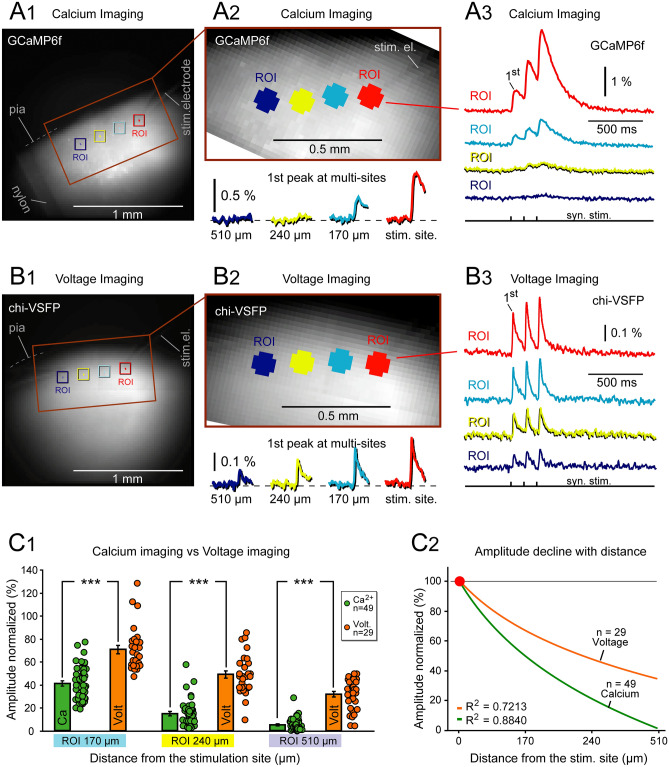
Attenuation of optical signals with distance from the stimulation site—calcium vs. voltage imaging. (A) A brain slice from transgenic animal expressing GCaMP6f in cortical pyramidal neurons. Synaptic stimulation electrode (el.) is positioned in cortical layer 2/3. (B) Blowup of the area marked by rectangle in (A). (C) Calcium signals recorded simultaneously from four ROIs marked by color in (B). Each trace is a spatial average of 21 pixels and temporal average of 4 trials. The first signal peak (response to the first synaptic pulse) is displayed on a greater scale below the image in (B). Signals at 170, 240 and 510 µm, from the stimulation site, are shown on identical amplitude and time scales. DEF Same as ABC, except the transgenic animal expresses chi-VSFP in cortical pyramidal neurons. (G1) Signal amplitudes (response to first synaptic pulse) were normalized against the amplitude obtained at the stimulation site (red ROI). Each dot represents one recording. Calcium: n = 27 traces, 5 slices, 3 animals. Voltage data: n = 29 traces, 9 slices, 6 animals. Bars represent mean ± SD. ***, p < 0.0001. (G2) Data points shown in G1 were fitted with logarithmic function and the trends are displayed. Distance “0 µm” is at the stimulation site (red ROI).

