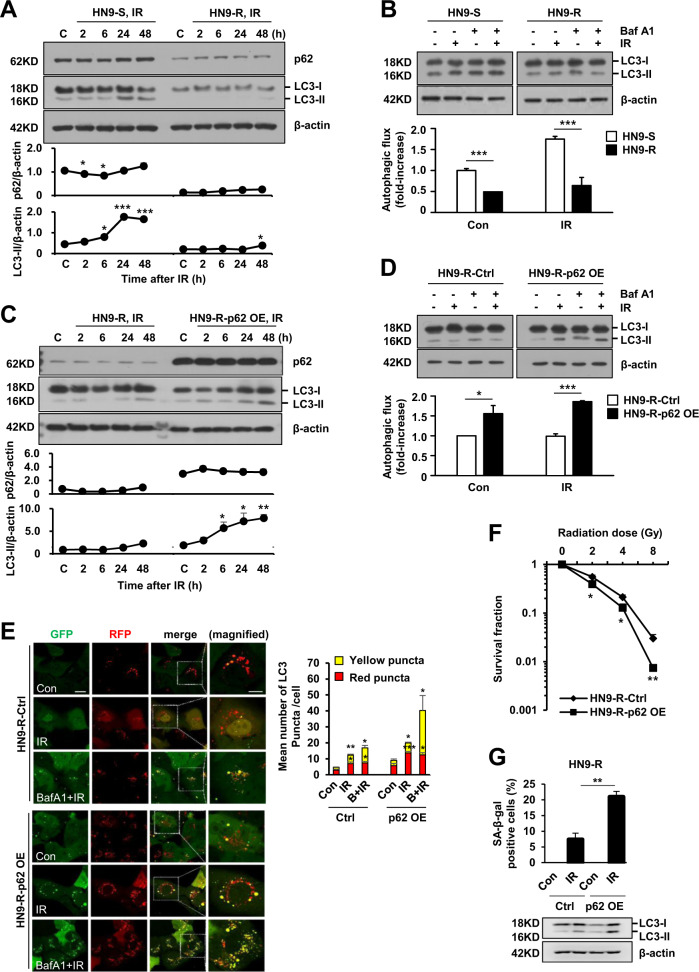
Fig. 6. Overexpression of p62 increases autophagic flux and senescence to responses to radiation in HN9-R clones.
A–D Turnover of LC3 over time after irradiation (IR) at 4 Gy (A, C) and accumulated amounts of LC3-II at 24 h after 4 Gy of IR in the presence of bafilomycin-A1 (Baf A1, 1 nM, 4 h; B, D) in HN9-S vs HN9-R clones (A, B) or vector control vs p62-overexpressed HN9-R clones (C, D) analyzed by immunoblotting. In B and D, the relative ratio of LC3-II to β-actin was used as an indicator of autophagic flux, which was calculated by comparing the cells treated with IR and Baf A1 to that with IR only. Results are presented as means ± standard error of the mean (SEM). Western blots are representative of three independent experiments. E Measurement of autophagic flux by mRFP-EGFP/MAP1LC3B puncta assay to irradiation (4 Gy, 6 h) after pretreatment of Baf A1 (10 nM, 1 h) in vector control and p62-overexpressed HN9-R clones. Graph represents quantification of RFP-positive, GFP-positive autophagosomes (yellow puncta) and RFP-positive, GFP-negative autolysosomes (red puncta). Scale bars, 20 μm in GFP image and 10 μm in magnified image. F, G Clonogenic survival (F) and percentage of cells positive for senescence-associated beta-galactosidase (SA-β-gal) staining of p62-overexpressed HN9-R after irradiation of 4 Gy (G). All results were obtained from at least three independent experiments. Results are presented as means ± standard error of the mean (SEM). *p < 0.05; **p < 0.01; ***p < 0.005.

