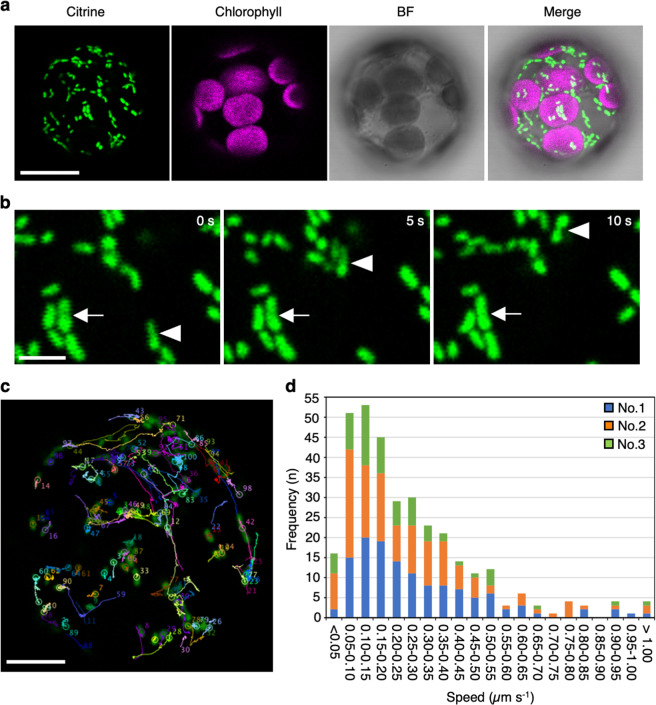
Fig. 1. Observation of mitochondrial movement in mesophyll protoplasts.
a Citrine fluorescence in mitochondria (green) and chlorophyll autofluorescence (magenta), and bright field (BF) image of mesophyll protoplasts of MTS-Citrine transgenic A. thaliana are shown as a merged image (Merge) taken by CLSM. Scale bar: 10 µm. b Time-lapse images of mitochondria taken every 5 s. Fast, directional movements (arrowheads) and slow, wiggling movements (arrows) of mitochondria are shown. Scale bar: 2 µm. c Representative images showing the trajectories of mitochondrial movements over a 30-s period. Mitochondrial movements were tracked and quantified using Fiji software and its plugin MTrackJ. Mitochondria are labeled with numbers and outlined with different colored lines. Scale bar: 10 µm. d Speed distribution of mitochondrial movement from three independent protoplasts (protoplast No. 1, blue; protoplast No. 2, orange; and protoplast No. 3, green).

