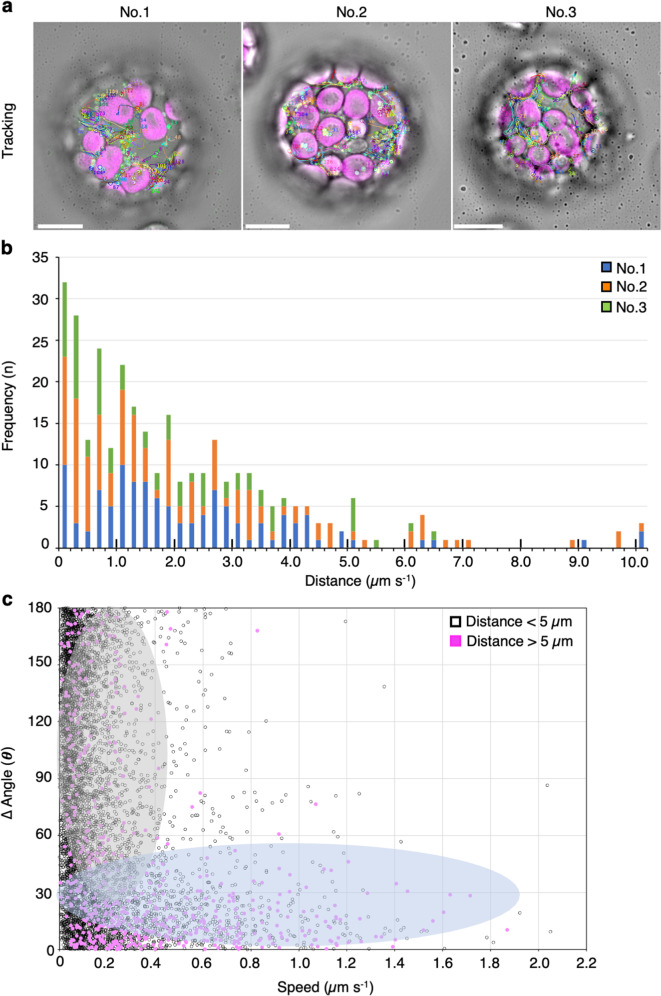
Fig. 2. Characterization of mitochondrial movements in leaf mesophyll protoplasts.
a Trajectories of mitochondrial movements constructed from time-lapse analysis of images of three different protoplasts (No. 1–3) acquired for 30 s at 250-ms intervals. Scale bar; 10 µm. b Distribution of the direct distance between the first and last point of mitochondria in the trajectories of mitochondrial movement acquired from three independent protoplasts (protoplast No. 1, blue color; protoplast No. 2, orange; and protoplast No. 3, green). c Scatter plot of speed (x-axis) and angle changes (y-axis) of mitochondria at each time point acquired from the trajectories of mitochondrial movement, which are separated based on a distance shorter (open circles) or longer (filled-magenta circles) than 5.0 µm in b. The plots are separated into two regions highlighted in gray and pale blue.

