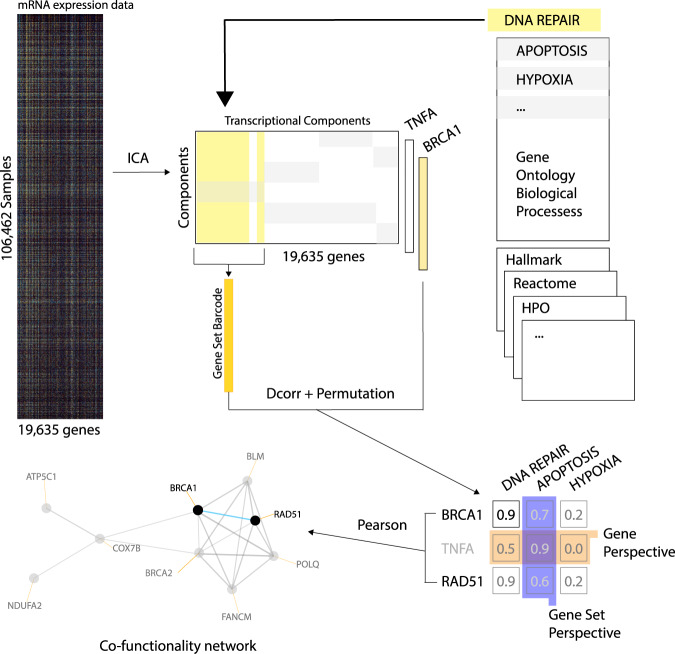
Fig. 1. Overview of the guilt-by-association methodology to calculate prediction scores.
Transcriptional components (TCs) are calculated from a large mRNA expression dataset using c-ICA or PCA. For every gene set in a gene set collection, a vector of means (transcriptional regulatory barcode) is calculated by taking the mean vector of weights in the mixing matrix of genes that are members of the gene set. The correlation of each gene and each barcode is calculated using distance correlation and a Z-transformed p value is estimated by performing a permutation test. The resulting Z-transformed p values constitute prediction scores that can be interpreted as a ranking of gene set memberships predicted for a gene (gene perspective). Alternatively, they can be interpreted as a ranking of genes predicted as members of a single gene set (gene set perspective). Finally, a gene-to-gene correlation matrix is calculated from the prediction scores and used to cluster genes in the force-directed layout of the co-functionality network visualization.

