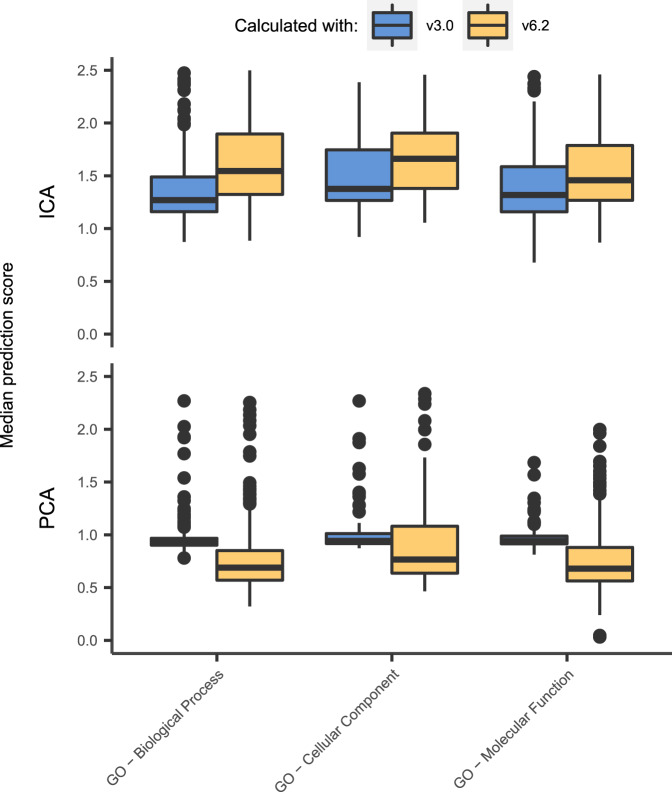
Fig. 3. ICA-TCs outperform PCA-TCs in predicting future gene set memberships.
The predictive power of the PCA-TC- and ICA-TC-based GBA prediction strategies was further evaluated by generating predictions using a previous version of three Gene Ontology gene set collections (Molecular Signatures Database C5 v3.0). Boxplots show the prediction scores for every gene set using only genes that were added to the gene set between v3.0 (blue) and v6.2 (yellow). Prediction scores of this subset of genes degrade when using the newer version of the gene set (area under the curves (AUCs) calculated from two-sided Mann–Whitney U test ranging from 0.19 to 0.34) when generating predictions with the PCA-TC- but not when using the ICA-TC-based method (AUCs ranging from 0.65 to 0.71). Only gene sets for which new members were included are depicted. Hinges of boxes represent second and third quartiles and whiskers extend by half that interquartile range. Center of box corresponds to median.

