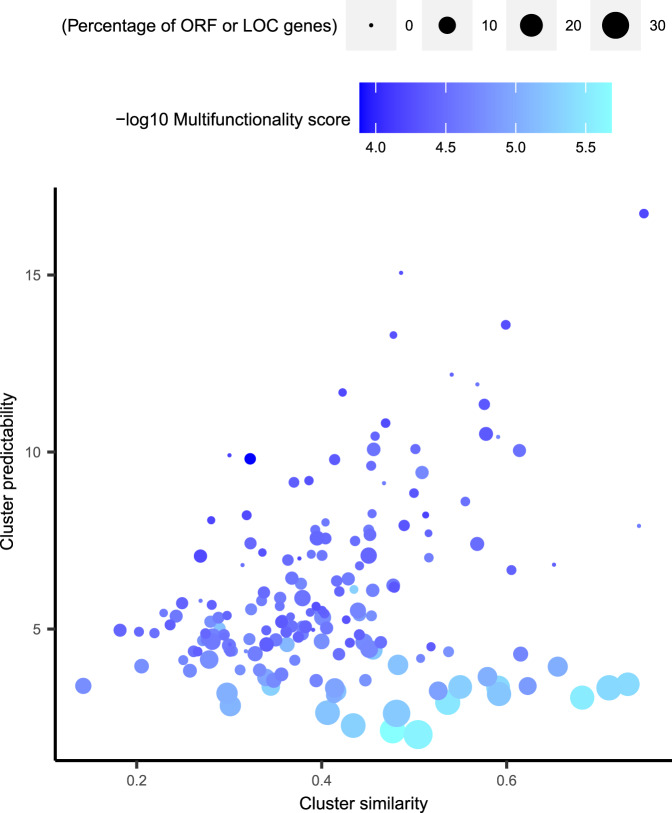
Fig. 5. Relationship between the degree of transcriptional similarity and predictability among clusters of co-regulated genes.
Scatterplot of cluster transcriptional barcode similarity (x-axis) and cluster predictability score (y-axis) for cluster groups (n = 173). The cluster transcriptional similarity is defined as the median pairwise distance between every gene in the cluster as defined in the distance correlation matrix. A median of the maximum prediction score of each gene in the cluster was calculated to represent the cluster predictability score. Multifunctionality is depicted with a gradient from high (dark blue) to low (cyan). Clusters with high similarity but low predictability scores are composed of more uncharacterized genes (ORFs and LOCs) than other clusters. In addition, the multifunctionality scores of the genes belonging to these clusters are low (cyan), reflecting low frequency of gene set memberships.

