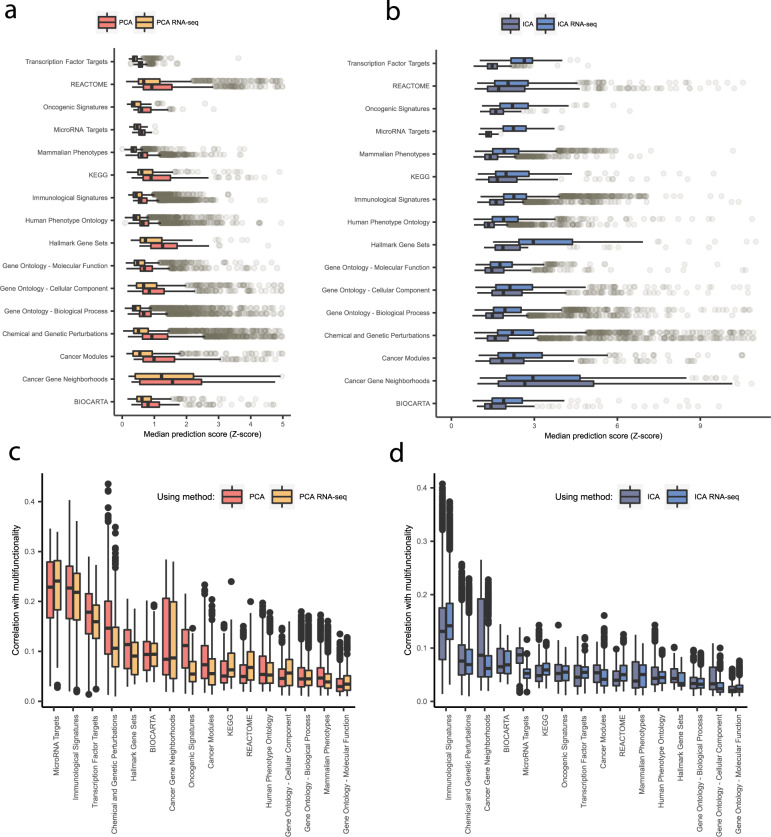
Fig. 9. Median prediction scores and multifunctionality association for RNA-seq-based predictions.
a, b Boxplot of median prediction scores (x-axis) calculated by applying the PCA-TC-based (a) or ICA-TC-based (b) method to microarray (red and dark blue) and RNA-seq (yellow and blue) input data for each of the 16 gene set collections (y-axis). Median prediction scores are calculated separately for each gene set using both RNA-seq and microarray input datasets for member genes. Prediction scores of PCA-TC-based method tend to be higher when using the microarray input dataset. Prediction scores of ICA-TC-based method tend to be higher when using the RNA-seq input dataset. c, d Boxplot of distance correlation between PCA-TC-based (c) or ICA-TC-based (d) gene set prediction scores and the gene set collection multifunctionality score (y-axis) for each gene set collection (x-axis). Predictions are calculated using microarray and RNA-seq input datasets. The magnitude of correlation varies across gene set collections and between gene sets in a collection. The PCA-TC and ICA-TC-based methods have comparable multifunctionality association when using RNA-seq and microarray input data for most gene set collections. Predictions obtained using the ICA-TC-based method have a lower association to multifunctionality for the microRNA Targets and Cancer Gene Neighborhoods gene set collections when using RNA-seq data as input. Hinges of boxes represent second and third quartiles and whiskers extend by half that interquartile range. Center of box corresponds to median.

