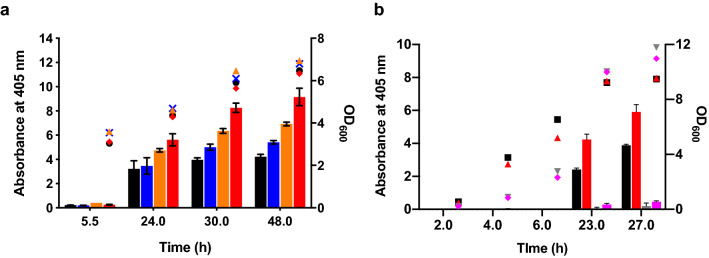
Figure 3.
Characterization of improved OsmY variants in 50-mL flask cultures. The OsmY-Tfu0937 activity, measured with the pNPG assay using an absorbance at 405 nm (left axis), are plotted as bars. The cell optical densities monitored at 600 nm (right axis) are shown as symbols. Cultures were inoculated using 1:100 dilution. (a) OsmY(WT) and variants were expressed using C41(DE3) in 2 × TY auto-induction media and at 37 °C and 200 rpm. The bars and symbols of the variants are represented using different colours; OsmY(WT) (black), OsmY(V43A) (blue), OsmY(S19C) (orange) and OsmY(TOA4) (red). Experiments were performed in triplicate. (b) OsmY(WT)-Tfu0937 and OsmY(TOA4)-Tfu0937 were expressed using C41(DE3) in 2 × TY auto-induction media, at 30 °C or 25 °C, and 200 rpm. The bars and symbols of the sample are represented using different colours; OsmY(WT) at 30 °C (black), OsmY(TOA4) at 30 °C (red), OsmY(WT) at 25 °C (grey), OsmY(TOA4) at 25 °C (magenta).

