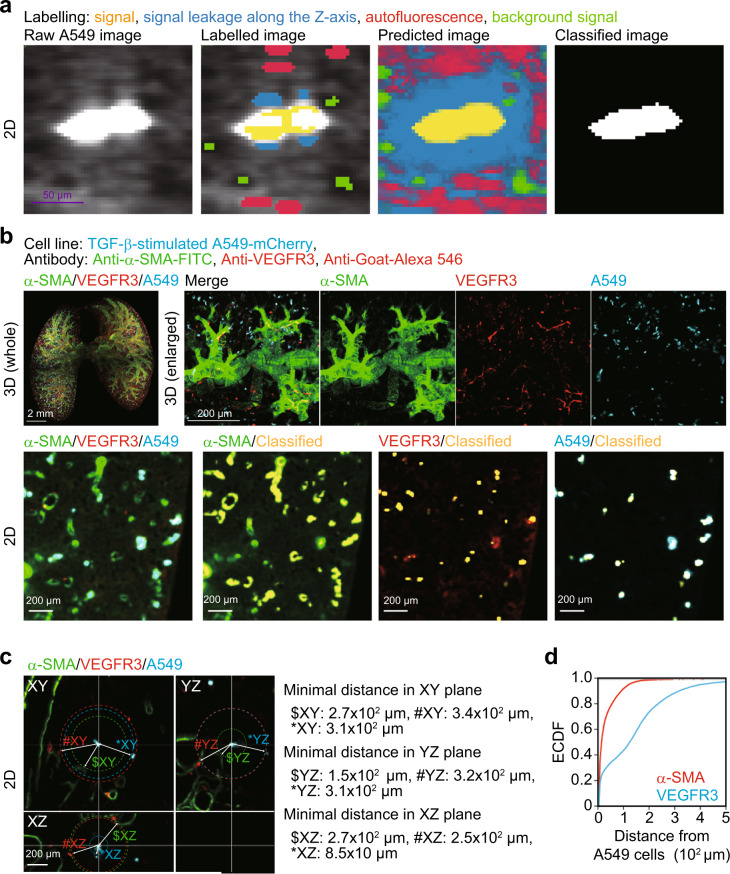
Fig. 2. Analysis of intercellular distance using whole-organ clearing protocol.
Whole-lung imaging of cancer cells and the tumour microenvironment. A549-mCherry cells were intravenously injected into mice (day 0). Then, the lung was subjected to whole-organ clearing protocol (day 7) and immunostained with anti-VEGFR3 antibody, followed by co-immunostaining with Alexa 546-conjugated anti-goat IgG antibody and FITC-conjugated anti-α-SMA antibody. After pixel classification by ilastik, the original 16-bit images were converted into binary images. a The visualization of pixel classification processes. We set four annotations: yellow annotations are true signal, blue annotations are signal leakage along the Z-axis, red annotations are tissue autofluorescence, and green annotations are background signal. Scale bar = 50 μm (purple). b Representative images. Yellow signals show classified signals of α-SMA, VEGFR3, and mCherry. c Quantification of minimal distance from cancer cells to α-SMA, VEGFR3, or mCherry-positive cells. $, #, and * indicate α-SMA, VEGFR3, and mCherry signal at the minimal distance from A549 in 2D plane, respectively. d The empirical cumulative distribution function (ECDF) of the minimal distance from cancer cells to α-SMA or VEGFR3 signals. 3D image (whole), scale bar = 2000 μm. 3D image (enlarged), scale bar = 200 μm. 2D image, scale bar = 200 μm. Mouse number in each group is n = 3. Representative result of two independent experiments.

