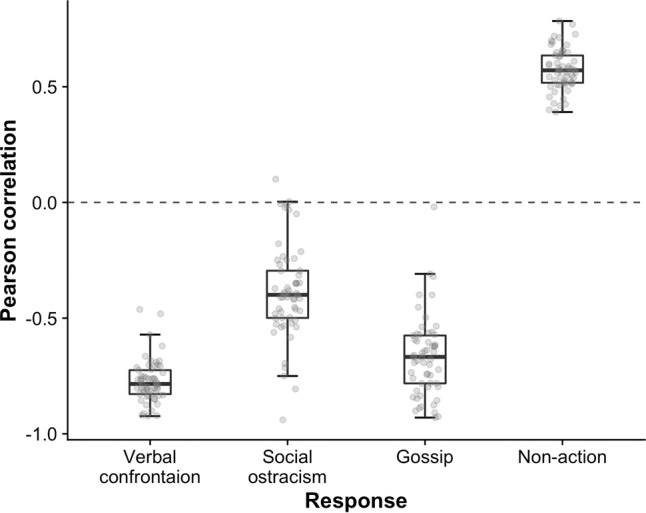
Fig. 1. Within-country correlations between appropriateness ratings of norm violations and different responses.

The vertical axis refers to the correlation, across n = 10 scenarios, between the (country level) appropriateness ratings of the norm violation and a given response to it. For every response, the corresponding boxplot presents how the value of the within-country correlation varied across n = 57 countries. Verbal confrontation, gossip, and social ostracism almost universally yielded negative correlations, while non-action universally yielded positive correlations. The dashed reference line indicates a zero correlation. The box represents the interquartile range with the dark line indicating the median. The whiskers reach the min and max values in case these are at most 1.5 times the box height outside the interquartile range. Individual data points are overlaid as dots.
