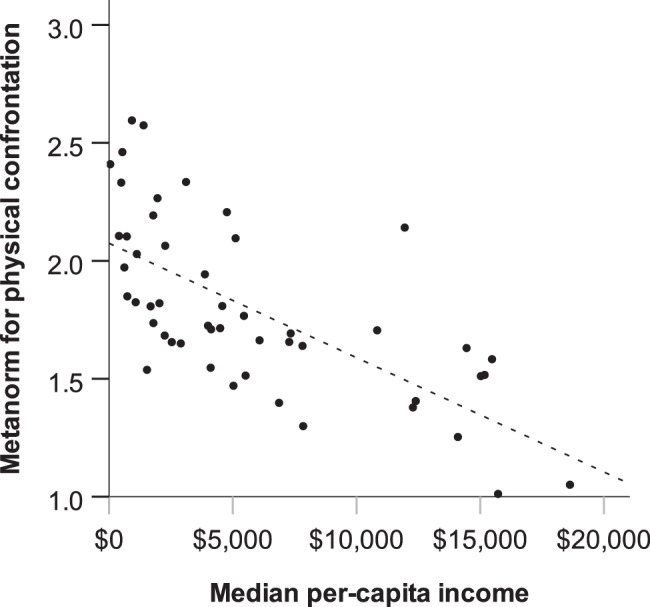
Fig. 2. The negative association of median income with the appropriateness rating of physical confrontation across 50 countries.

Including regression line (R2 = 0.45). Every dot represents a country. The x-axis represents median per-capita income according to Gallup24. The y-axis represents the metanorm for physical confrontation, that is, the mean appropriateness rating for scenarios where someone responds to a norm violation by physical confrontation.
