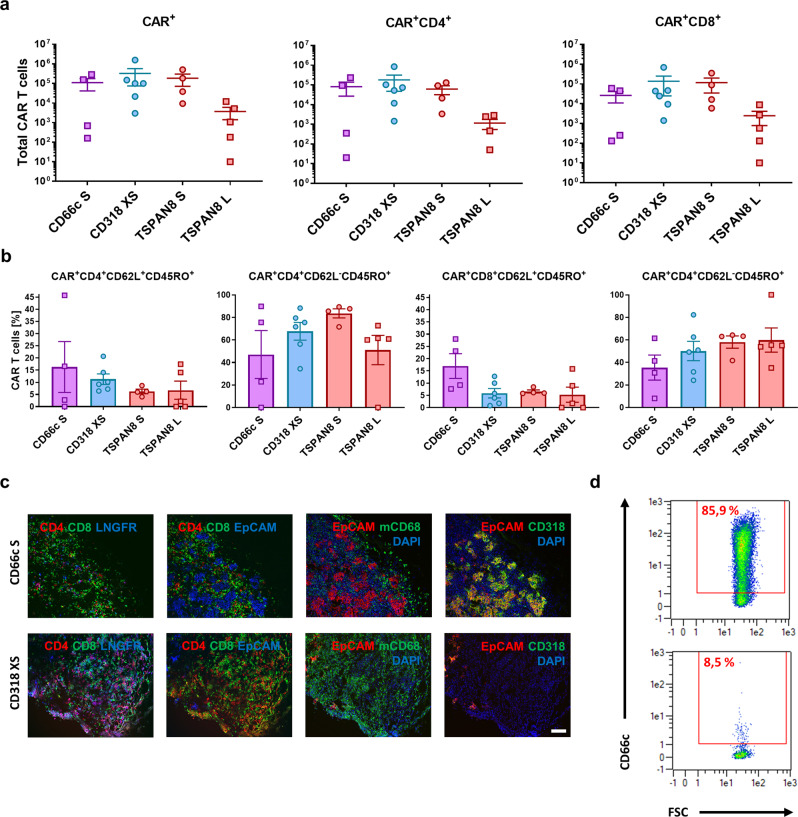
Fig. 5. Ex vivo analysis of the T cell phenotype and AsPC1-derived tumor tissues upon treatment with CAR T cells.
a Number of CAR T cells in the spleen at the end of the experiment 27 days post CAR T cell injection (CD66c S: n = 4, CD318 XS: n = 6, TSPAN8 S: n = 4, TSPAN8 L: n = 5). b Phenotype of CAR T cells in the spleen at the end of the experiment 27 days post CAR T cell injection, as demonstrated by the percentage of TCM and TEM (n equal to a). All data are shown as mean ± s.e.m. c Representative immunofluorescence images of (CAR) T cell tumor infiltration, macrophage tumor infiltration and target expression (CD318 XS tumor 9 days post CAR T cell injection, CD66c S tumor 27 days post CAR T cell injection). Staining was performed on one tumor of the respective treatment group and each image is representative for at least two regions of interest. Regions of interest during cyclic IF were chosen based on manual prestaining of DAPI and EpCAM. d Density plots of a dissociated AsPC1 xenograft showing CD66c expression 35 days post injection of 5e6 CD66c S Vl-Vh CAR T cells (top) and the unstained control (bottom). Scale bar = 100 µm. Source data are provided as a Source Data file.

