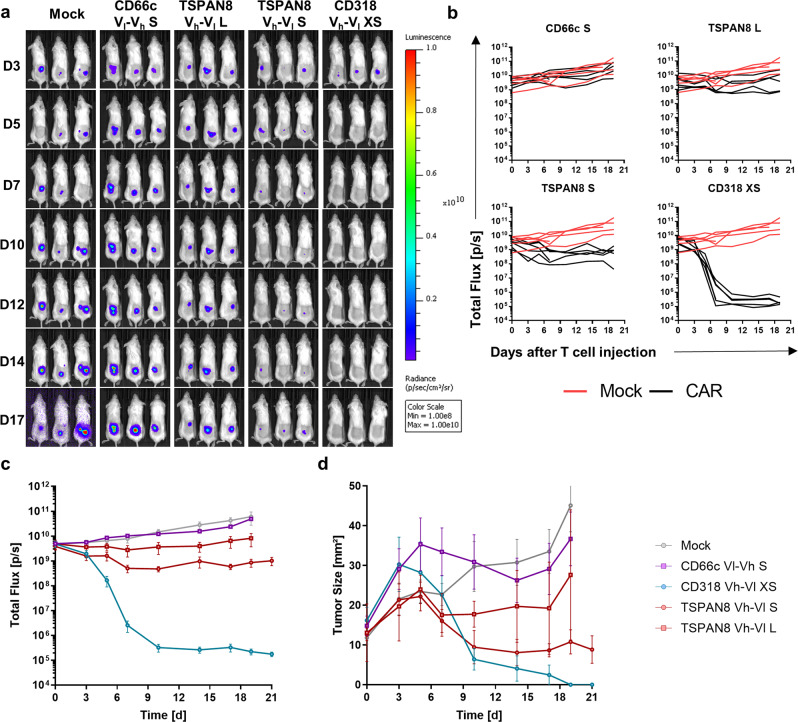
Fig. 6. Evaluation of CAR T cell in vivo functionality in a BxPC3 xenograft model.
a Representative bioluminescence images of tumor-bearing NSG mice. Tumors were induced by subcutaneously transplanting luciferase expressing BxPC3 (color scale for all images, min = 1 × 10⁸, max = 1 × 10¹⁰). Mice were randomized and treated upon established solid tumors reached 25 mm² (day 15) by intravenous infusion of 1 × 10⁷ CAR T cells or Mock T cells. b Development of tumor burden for individual mice treated either with Mock T cells or with the respective CAR T cells (Mock: n = 6, CD66c S: n = 6, CD318 XS: n = 6, TSPAN8 S: n = 6, TSPAN8 L: n = 6). c Average bioluminescence ± s.e.m. of the respective treatment groups (n equal to b). d Average tumor size ± s.e.m. of the respective treatment groups (n equal to b). Source data are provided as a Source Data file.

