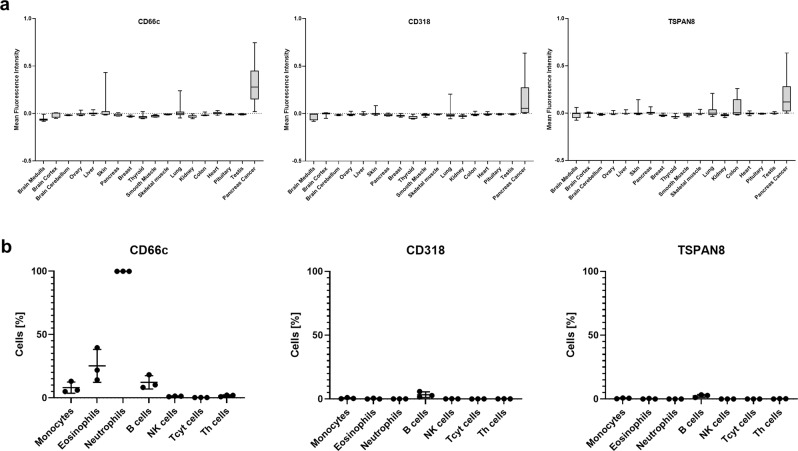
Fig. 9. Off-tumor target expression.
a Quantification of target expression within different healthy tissues. Box-and-Whisker Plots show the distribution of the background corrected mean fluorescence intensity of identified cells in the respective tissues. The lower and upper hinges in the Box-and-Whisker Plots correspond to the first and third quartile (25th and 75th percentiles). The bar in the box depicts the median. Whiskers extend to the 5th and 95th percentile. CD66c: n (left to right) = 4603, 1695, 716, 6591, 5746, 13301, 8682, 1731, 13391, 4066, 5878, 2966, 2737, 10844, 11595, 7405, 3671, 3371. CD318: n (left to right) = 9341, 6542, 5282, 11438, 10593, 18148, 18395, 6578, 18238, 8913, 10725, 7813, 7584, 13933, 16442, 12252, 7112, 8218. TSPAN8: n (left to right) = 9341, 6554, 5563, 11438, 10593, 18148, 18395, 6578, 18238, 8913, 10725, 7813, 7584, 13933, 16442, 12252, 7112, 8218. b Flow cytometric analysis of target expression on lysed blood samples. Data represent mean ± SD of three donors. Source data are provided as a Source Data file.

