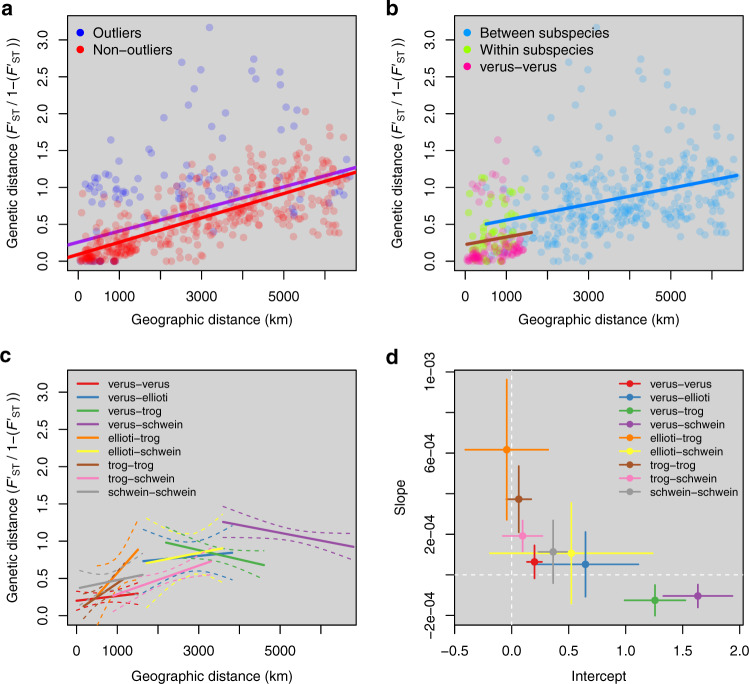
Fig. 2. Linear regressions of genetic distance as a function of geographic distance.
a Linear regressions of genetic distance as a function of geographic distance for all sites with at least six genotyped individuals. Blue dots represent pairwise comparisons involving outlier sites (Mt. Sangbé, Gashaka and Issa, see text). The purple line is fitted to the entire dataset, while the red line is fitted to the dataset excluding the three outlier sampling locations. When excluding the three outlier sites, geographic distance explains 58% of the genetic distance. b Linear regressions of genetic distance as a function of geographic distance for between- and within-subspecies comparisons. Blue dots represent between-subspecies pairwise comparisons with linear regression (blue line). Green and pink dots represent within-subspecies pairwise comparisons with linear regression (brown line) characterized by a noticeably lower y-intercept. Pan troglodytes verus–P. t. verus comparisons (pink dots), which have the lowest genetic diversity of all subspecies, make up 60% of all the within-subspecies comparisons and are largely driving this observed pattern, explaining the source of the stratification in a. c Linear regressions of genetic distance as a function of geographic distance for each subspecies comparison pair. Solid lines represent fitted regressions, and dashed lines enclose 95% confidence intervals. d Estimates (circles) and standard errors (crosses) of intercept and slope for each of the regressions in c.

