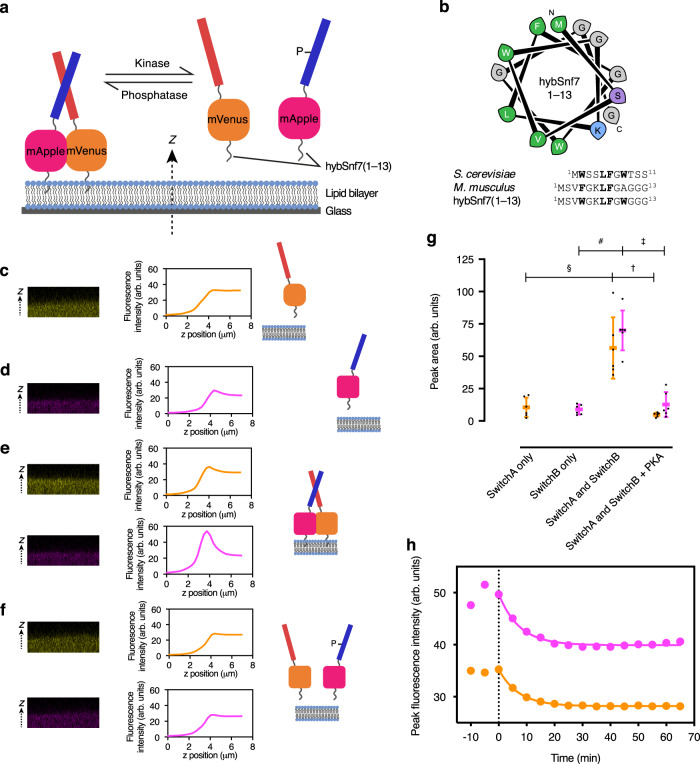
Fig. 4. Oligomeric switching of membrane-binding state.
a Schematic illustrating design and concept of switching with CC-Di-A_S colored red and CC-Di-B_RRS blue. b Helical wheel diagram of hybSnf(1–13) and alignment of S. cerevisiae, M. musculus, and hybrid Snf7 sequences with conserved hydrophobic residues highlighted in bold. c–f Representative orthogonal views of the xz plane of confocal microscopy image z-stacks with fluorescence intensity z-profiles and illustrative schematics for SLBs with: c 1 µM SwitchA only, d 1 µM SwitchB only; e 1 µM each of SwitchA and SwitchB; and f 1 µM each of SwitchA and SwitchB 1 h after MgATP and PKA were added. g Quantitation of membrane binding of SwitchA (orange) and SwitchB (pink) under the conditions of panels c–f calculated from fluorescence z-profiles (n = 6 independent experiments; error bars represent mean ± S.D.; §p = 0.0011, t = 4.5167; #p < 0.0001, t = 9.4307; †p = 0.0003, t = 5.3073; ‡p < 0.0001, t = 7.7144; unpaired two-tailed t test). h Representative kinetics of phosphorylation-induced release of SwitchA and SwitchB from the SLB after the addition of MgATP and PKA at t = 0. Plotted fluorescence intensities (arbitrary units) are peak intensities (i.e., membrane localized), determined from z-axis fluorescence intensity profiles such as those shown in c–f. Values were fitted with the function . SLBs were DOPC with 0.1 mol% ATTO655-DOPE. The SLB buffer was 50 mM Tris.HCl, pH 7.5, 300 mM KCl, and 5 mM MgCl2. Six experimental replicates were performed.

