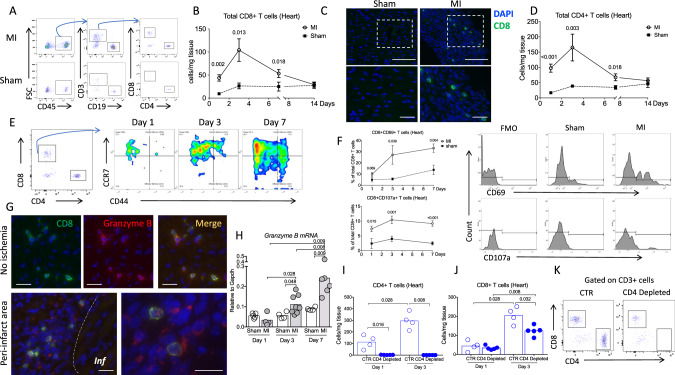
Fig. 1. Cytotoxic CD8+ T lymphocytes are activated and recruited to the ischemic tissue after myocardial infarction.
A Representative examples of CD4+ and CD8+ T cell staining in the heart of C57BL/6J mice following coronary ligation (MI) or sham surgery. B Kinetic of CD8+ T cell infiltration in the myocardium, performed at days 0, 1, 3, 7, and 14 after surgery in MI (white circle, n = 9/12/12/5, respectively, at day 1/3/7/14) and sham-operated mice (black box, n = 6/time point); data are presented as mean ± SEM. C Immunostaining in the ischemic myocardium at day 3 after MI or sham showing CD8+ T infiltration (green) in the ischemic heart tissue, scale bar 40 μm. D Kinetic of CD4+ T cell infiltration in the myocardium, performed at days 0, 1, 3, 7, and 14 after surgery in MI (white circle, n = 10/9/12/5, respectively, at day 1/3/7/14) and sham-operated mice (black box, n = 6/time point); data are presented as mean ± SEM. E Flow cytometry characterization of CD8+ T cell subsets in the ischemic heart at days 1, 3, and 7 after MI including naïve (CD3+CD8+CCR7HighCD44−), effector memory (CD3+CD8+CCR7LowCD44+), and central memory (CD3+CD8+CCR7HighCD44+) subsets. F Representative examples and quantitative analysis of CD8+ T cells expressing CD69 or CD107a within the ischemic heart tissue in MI (white circle, n = 6/9/12, respectively, at day 1/3/7) and sham-operated mice (black box, n = 6/time point); data are presented as mean ± SEM. G Immunostaining in the ischemic myocardium at day 3 after MI showing CD8+ T cells (green), and Granzyme B (Red) and merged area (Yellow), Inf for infarct area; scale bar 40 μm. H mRNA levels of Granzyme B within the injured myocardium on days 1, 3, and 7 after coronary ligation (gray, n = 5/4/5 at day 1/3/7) or sham (white, n = 4/8/6 at day 1/3/7). I C57Bl6 WT mice received intraperitoneal injection of isotype control (CTR, blue borderline, n = 4/time point) or anti-CD4 depleting monoclonal antibody (blue filled, n = 5/time point) (150 μg/mice) 1 day before coronary occlusion. CD4+ T cell depletion was confirmed in the heart by flow cytometry at day 1 and day 3 following MI. J, K Quantification and representative example of CD8+ T cell count in the heart of control (n = 4/time point) or CD4-depleted (n = 5/time point) mice at day 1 and day 3 after MI. P values were calculated using two-tailed Mann-Whitney test (B, D, F, H, I, J). Inf, infarct; MI, myocardial infarction; FMO, fluorescent minus one.

