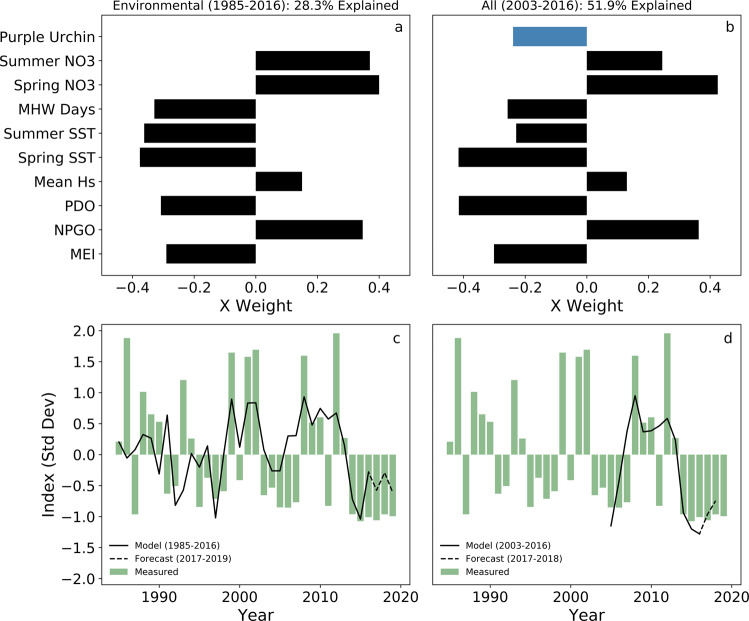
Fig. 3. Results of Partial Least Squares Regression analysis for environmental and biological drivers of kelp canopy area from 1985 to 2019.
Component 1 partial least squares regression (PLSR) x weights (top row) from environmental indices across 1985 to 2016 (a) and both environmental and biological indices from 2003 to 2016 (b). PLSR models and forecasts using all components overlaid on satellite-derived kelp canopy (c, d). See supplementary data for detailed PLSR results (Supplementary Table 1). Predictor variable acronyms are as follows: purple urchin density—‘Purple Urchin’; seasonal nitrate concentrations—‘Summer NO3’ and ‘Spring NO3’; marine heatwave days—‘MHW Days’; seasonal sea surface temperature— ‘Summer SST’ and ‘Spring SST’; mean significant wave height—‘Mean Hs’; Pacific Decadal Oscillation—‘PDO’; North Pacific Gyre Oscillation—‘NPGO’; Multivariate El Niño/Southern Oscillation Index—‘MEI’. See Methods for a detailed description of how each environmental variable influence kelp canopy dynamics.

