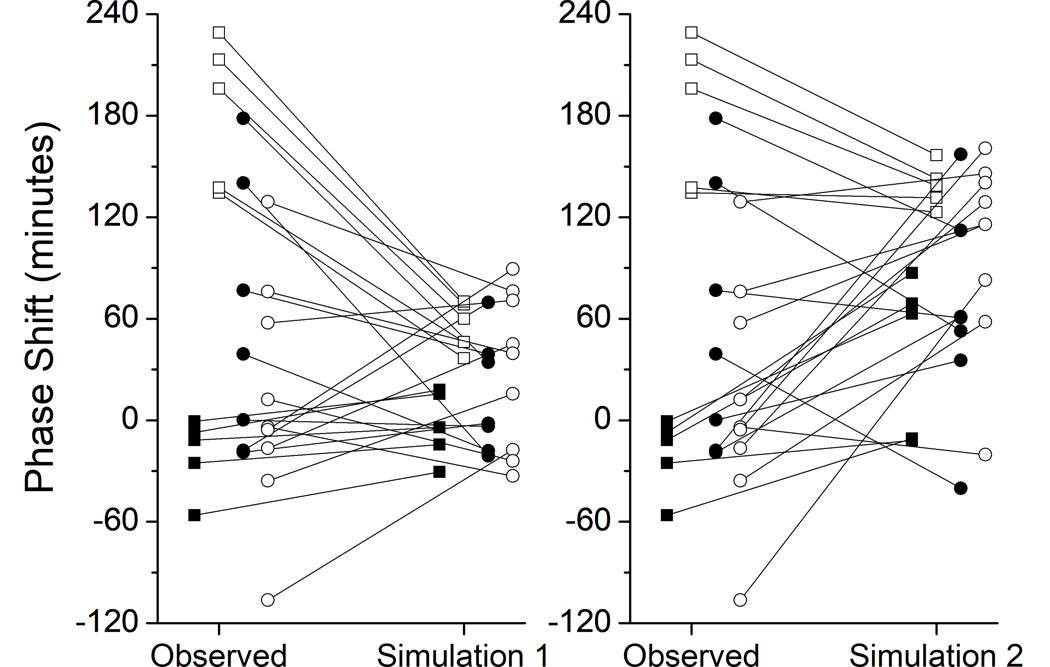
Figure 3. Observed versus predicted phase shifts by group.
The observed and predicted phase shift (in min) for each participant is shown. Left panel: Observed phase shift vs. Simulation 1; Right panel: Simulation 2. Control = filled squares (■); ST+L = open squares (□); ST = filled circles (●); SA = open circles (❍).

