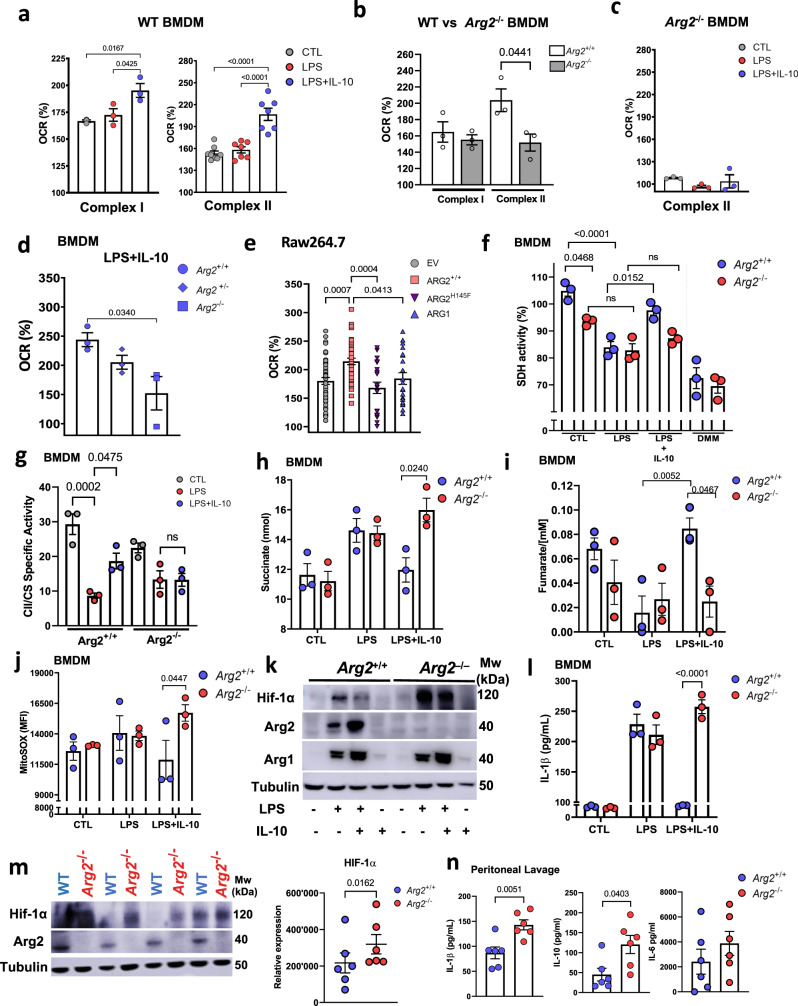
Fig. 4. Arginase-2 influences complex-II activity and regulates IL-1β secretion.
a–e XFe96 based comparison of complex I and/or complex II specific OCR in untreated (CTL) BMDM or stimulated cells (with LPS or LPS + IL-10 for 24 h). Data plotted as oxygen consumption rate percentage (OCR%) increase after addition of substrate: a wild-type cells. n = 3 (complex I) and n = 7 (complex II) biological replicates. b Quiescent wild-type (Arg2+/+) vs Arg2–/–, c CTL vs stimulated Arg2–/–, d LPS + IL-10 stimulated Arg2+/+, Arg2+/–, and Arg2–/–; b–d Data shown are biological n = 3. e Complex II specific OCR in Raw 264.7 overexpressing pCMV-SPORT6 plasmids for EV (empty vector), Arg2, H145F, and Arg1. Data show 20 technical replicates (for H145F and Arg1) and 40 technical replicates (for EV and Arg2) over two independent experiments. f SDH activity as determined by MTT assay in Arg2+/+ and Arg2–/– BMDM. SDH inhibitor dimethylmalonate (DMM) used as a control (n = 3 biological replicates). g Complex II specific activity measured by UV-VIS spectrophotometry in lysates from Arg2+/+ and Arg2–/– BMDM. Activity was normalized to citrate synthase (CS) as control (n = 3 biological triplicates), h–l Comparison of wild-type (Arg2+/+) and Arg2–/– BMDM for levels of h succinate, i fumarate, j mitochondrial ROS (mtROS) by staining with mitoSOX, k protein expression for Hif-1α, Arg2, Arg1, and β-tubulin (as loading control); l IL-1β ELISA comparing secretion levels in supernatants. h–j, l n = 3 biological replicates, and k representative of n = 3 independent experiments; m, n Arg2+/+ and Arg2–/– C57Bl/6J mice were given i.p injection of LPS at 10 mg/kg for 8 h: m (Left) Hif-1α, Arg2, and β-tubulin in spleen. Blot representative of six mice each from wild-type (WT) and Arg2–/–. (Right) densitometry analysis showing relative expression levels of Hif-1α (n = 6); n IL-1β, IL-10, and IL-6 secretion levels in peritoneal lavage (n = 6 biological replicates). a–j, l–n Data are presented for scatter plots as mean ± SEM. Data were analysed by a–g, l ordinary one-way ANOVA with Tukey’s multiple comparisons, h, j, n two-tailed t-test with Welch’s correction, and I, m two-tailed paired t-test. Wherever significant, exact p-value is given on the figure.

