
Figure 2.
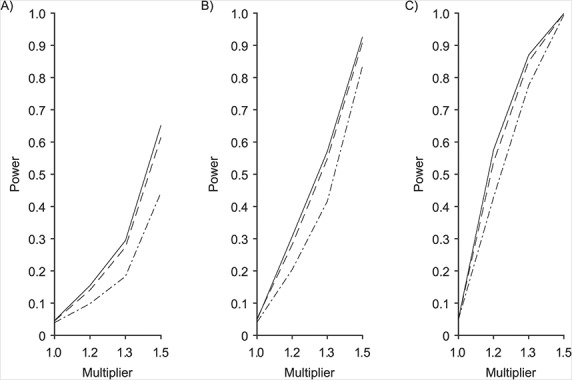
Power to discriminate Dirichlet multinomial samples as a function of the multiplier,  , that perturbs the parameters for 5 randomly selected phyla, as described in Methods. Results are shown for n = 25 (A), 50 (B), and 100 (C) samples in each group based on Bray-Curtis dissimilarity. The solid locus represents the 2-degrees-of-freedom (df) test (or Hotelling T2 test) based on standard reference samples; the dot-dashed locus represents the 5-df test; and the dashed locus represents microbiome regression-based kernel association test (MiRKAT). Power estimates are based on 3,000 independent simulations for each multiplier, 1.0, 1.2, 1.3, and 1.5.