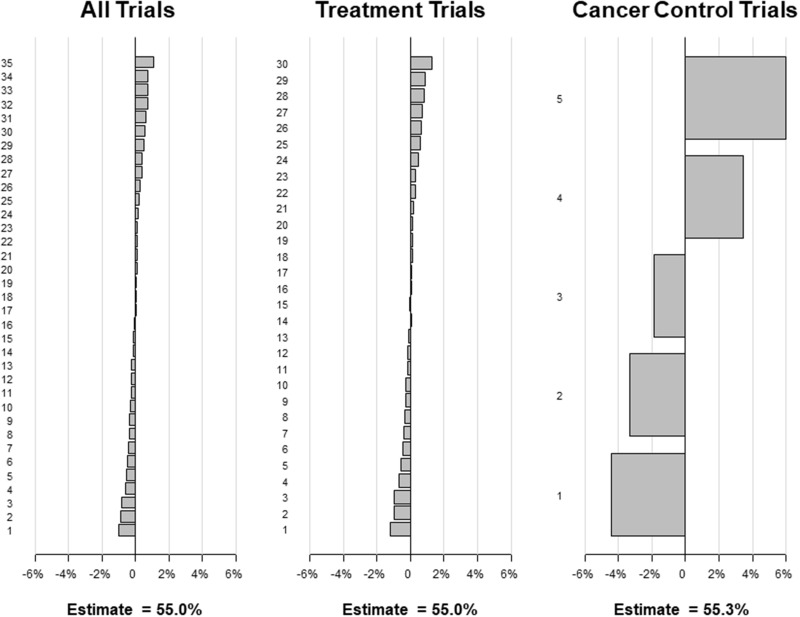
Figure 3.
Sensitivity analysis results for the “leave one out” method. Under this approach, each of the individual studies is left out of the calculation of the meta-analytic rate one at a time, and the rate is recalculated using the random-effects approach. Each panel shows the absolute percentage increase or decrease in the overall estimated rate for all trials, for treatment trials, and for cancer control trials, respectively. The primary estimates are also shown. The results are ordered in descending order from largest absolute positive percentage change to largest absolute negative percentage change.

