Figure 1.
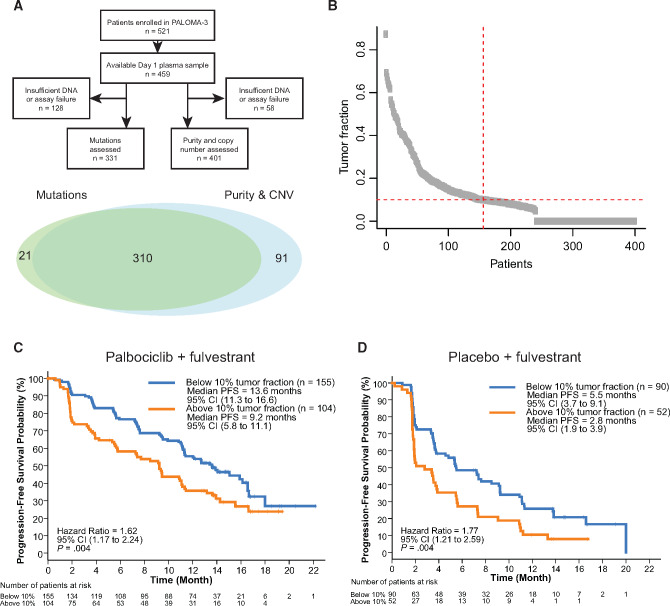
Circulating tumor fraction and progression free survival (PFS) in PALOMA-3. A) CONSORT and Venn diagram showing analysis of plasma samples from the PALOMA-3 trial. B) Distribution of detected circulating tumor fraction at baseline (n = 401). C) PFS for the palbociclib plus fulvestrant group (n = 259) split by circulating tumor fraction above or below 10%. D) PFS for the placebo plus fulvestrant group (n = 142) split by circulating tumor fraction above or below 10%. P values are log-rank. CI = confidence interval; CNV = copy number variant.

