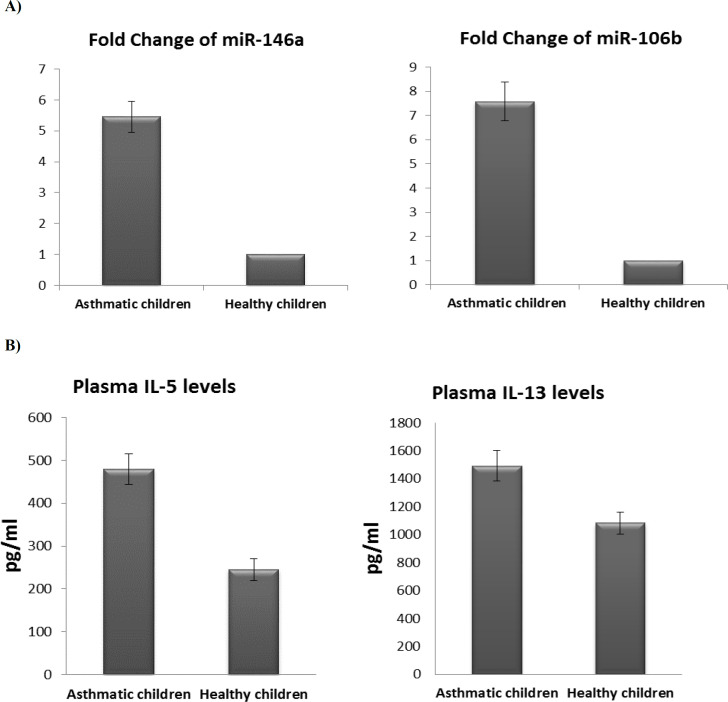
Fig. 1.
Expression of miRNAs and levels of the inflammatory cytokines in asthmatic and normal children. A) Fold change of miR-146a and miR-106b in asthmatic children relative to healthy controls. Bars show the mean ± SEM fold change. (**: significant, P < 0.05 versus controls, by independent samples t-test); B) Plasma levels of IL-5 and IL-13 in asthmatic and healthy children are shown. Bars show the results as the mean ± SEM. (non-significant, P> 0.05 versus controls, by non-parametric Mann-Whitney U test)

