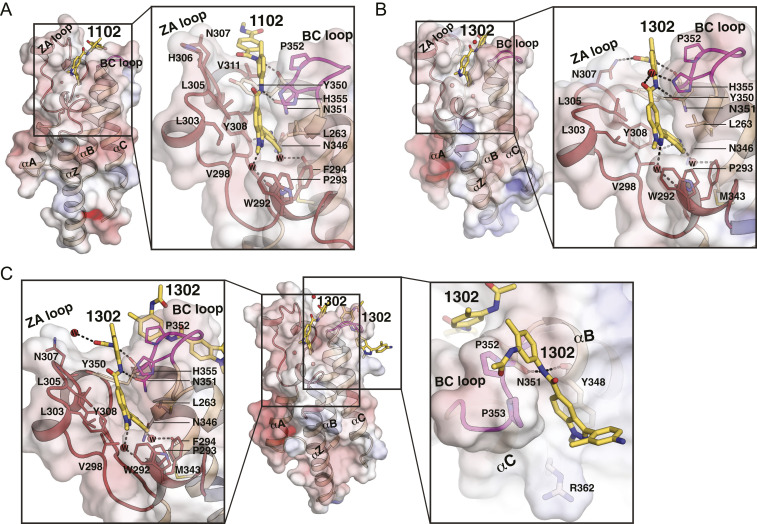
Fig. 4.
Detailed BRDT-BD2 inhibitor interactions. (A) BRDT-BD2/CDD-1102 complex. The electrostatic potential surface is shown with the secondary structure on the Left and a zoom-in view of detailed interactions on the Right. The ZA loop is colored in red, the BC loop is in magenta, and the rest are in wheat. CDD-1102 is shown as sticks and colored by atom type, with carbon in yellow, nitrogen in blue, and oxygen in red. The ordered waters are shown by red spheres. The hydrogen bonds are shown by dotted lines. (B) BRDT-BD2/CDD-1302 complex with one CDD-1302 bound. The electrostatic potential surface is shown with the secondary structure on the Left and a zoom-in view of detailed interactions on the Right. CDD-1302 is colored by atom type using the same color scheme as in A. (C) BRDT-BD2/CDD-1302 complex with two CDD-1302 bound. The electrostatic potential surface is shown with the secondary structure in the cartoon in the Center. Zoom-in views of detailed interactions for CDD-1302 bound at the KAc pocket are shown on the Left, and the second site is on the Right.

