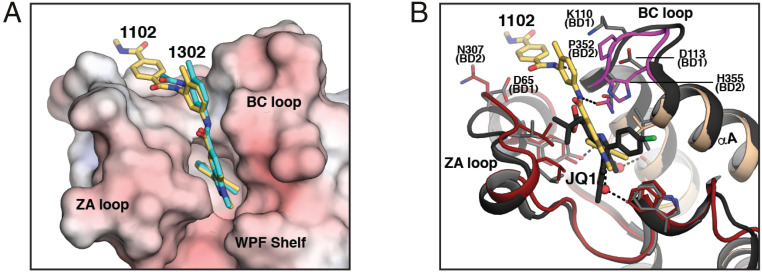
Fig. 6.
Structure comparisons. (A) Superposition of the BRDT-BD2/CDD-1102 and BRDT-BD2/CDD-1302 complexes. The BD2/CDD-1102 complex is superimposed with the BD2/CDD-1302 complex. Only the electrostatic potential surface belonging to the BD2/CDD-1302 complex is shown. CDD-1102 and CDD-1302 are colored using the same color scheme as in Fig. 4 except for carbon atoms of CDD-1302 (cyan). (B) Superposition with the BRDT-BD1/JQ1 complex. The BRDT-BD2/CDD-1102 complex (PDB ID code 7L9A) is superimposed with the BRDT-BD1/JQ1 complex (PDB ID code 4FLP). For the BRDT-BD2/CDD-1102 complex, the ZA loop is colored in red, the BC loop is in magenta, and the rest is in wheat. BRDT-BD1 is colored in black. Key interacting residues are shown as sticks. BD2-specific contact residues and corresponding BD1 residues are labeled. JQ1 is colored by atom type using the same color scheme except for carbon (black), chloride (green), and sulfur (yellow).

