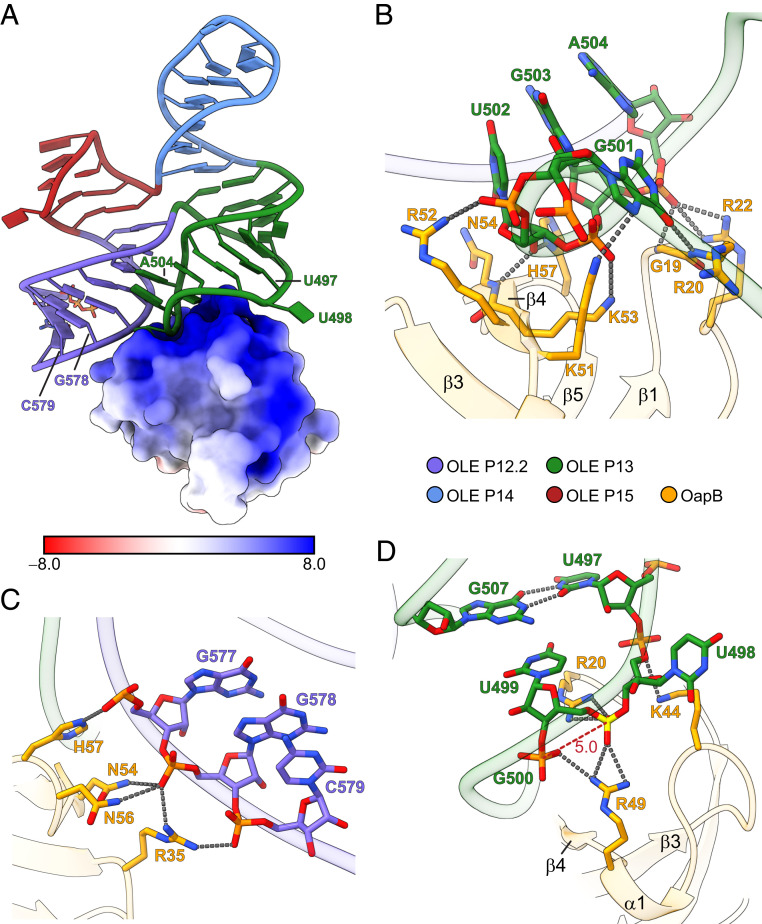
Fig. 3.
Molecular basis of OLE RNA recognition by OapB. (A) Electrostatic surface representation of OapB in complex with OLE*. The unit of electrostatic potential is kT/e−. (B) A close-up view of the OapB–OLE RNA interactions at the P13 GNRA tetraloop region. Hydrogen bonds are shown as gray dashed lines. (C) A close-up view of the interactions between OapB and the helix backbone of P12.2. (D) A close-up view of the OapB–OLE RNA interactions near the bulged U498 nucleotide. The phosphate group connecting U498 and U499 is highlighted in yellow. The phosphate-to-phosphate distance between U499 and G500 is indicated (in Å) and labeled with a red dashed line.

