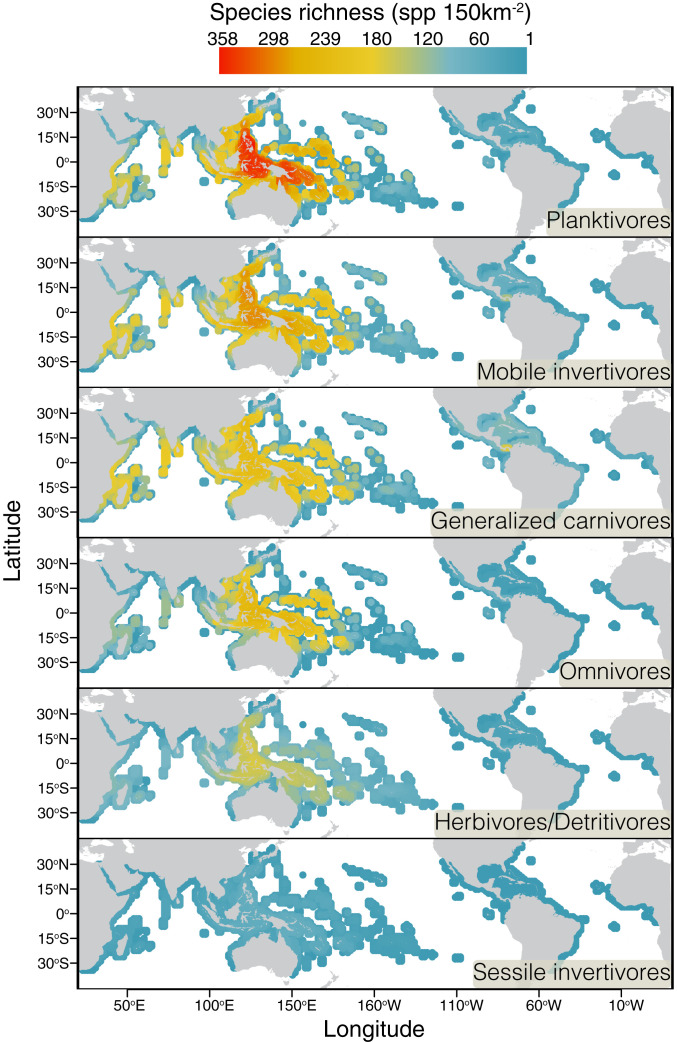
Fig. 1.
Global coral reef fish richness per trophic group. Maps show the absolute number of species per grid cell (n = 2,800) in each classified trophic group. Cell colors correspond to the scale bar and range from low (blue) to intermediate (yellow) and high (red) richness. Grid cell resolution is 150 km2 (see Rabosky et al., 27).

