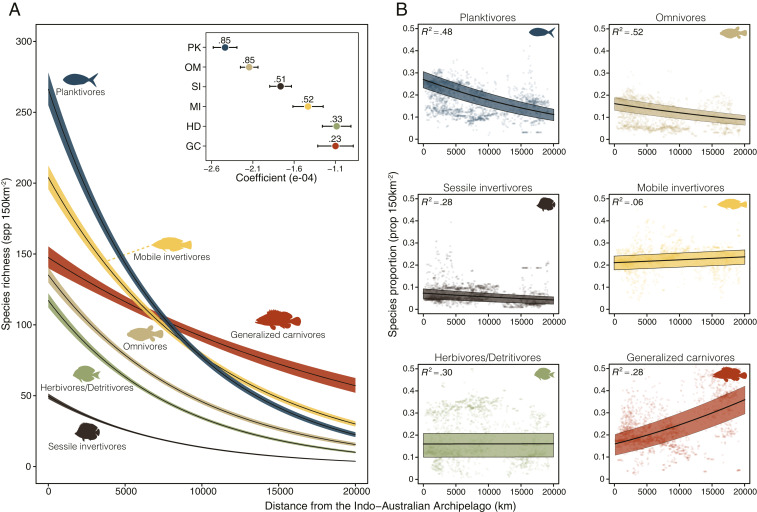
Fig. 2.
Global coral reef fish species richness (A) and proportion (B) per guild with distance from the IAA. (A) Number of species per grid cell (mean [black line] ± 95% CI [colored shading]) predicted from a negative binomial model per trophic group. The inset displays the model coefficient (±95% CI) per trophic group along with the R2 value of each model. Lines in the main figure represent the interaction between mean body size and trophic group; therefore, their perceived inclination may not match the size-independent coefficient represented in the Inset. (B) Proportion of species per grid cell in each trophic group (mean [black line] and interquartile range [colored shading]) predicted from beta regression models. Respective pseudo-R2 values are shown in the top left corners. Semitransparent dots represent sampled grid cells (n = 2,800). Predictions from all models were performed with body size fixed in the estimated value for the cells closer to the center of the IAA. Trophic groups: generalized carnivores, red; herbivores/detritivores, green; mobile invertivores, yellow; omnivores, beige; planktivores, blue; sessile invertivores, brown.

