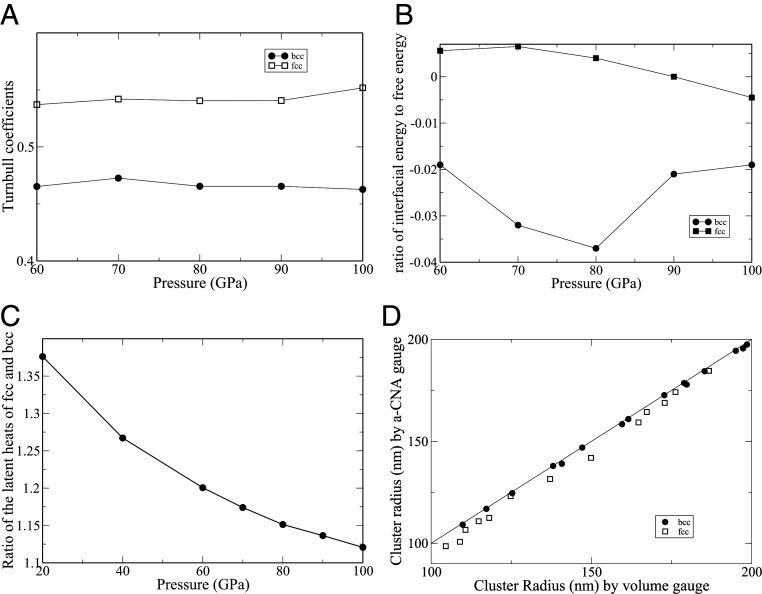
Fig. 4.
(A) Calculated Turnbull coefficients for the fcc and the bcc phases as a function of pressure. (B) Ratio of the interfacial energy to the interfacial free energy of the fcc and the bcc phases as a function of pressure. (C) Ratio of the latent heats of the fcc and the bcc phases as a function of pressure. (D) Comparison of two different algorithms (gauges) for extracting cluster radii from MD simulations. The filled circles are bcc-cluster radii extracted from two-phase simulations at different temperatures and pressures ranging from 60 to 100 GPa. The open squares are fcc-cluster radii extracted from two-phase simulations at different temperatures and pressures ranging from 60 to 100 GPa.

